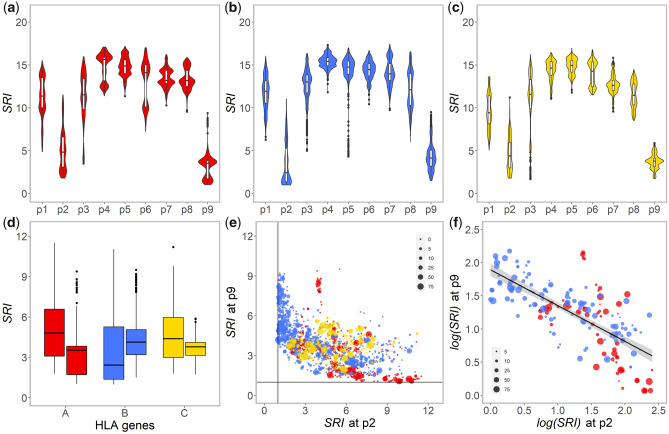
Fig. 5.
Violin charts of SRI of amino acid residues at each position (p1–p9) of the top 1% among the 200,000 9-mer peptides showing the highest binding affinity (BAscore) to 2,909 HLA-A (a), HLA-B (b), and HLA-C (c) molecules as well as a Box plot synthesizing the results at p2 and p9 for the three genes (d); a plot of SRI values at p2 against SRI values at p9, for 2,909 HLA-A (red), HLA-B (blue), and HLA-C (yellow) molecules (e); and plot of log(SRI) at p2 against log(SRI) at p9 , for 194 HLA-A (red) and HLA-B (blue) common molecules (f), in the latter two the symbol sizes representing the range of their distribution in populations.

