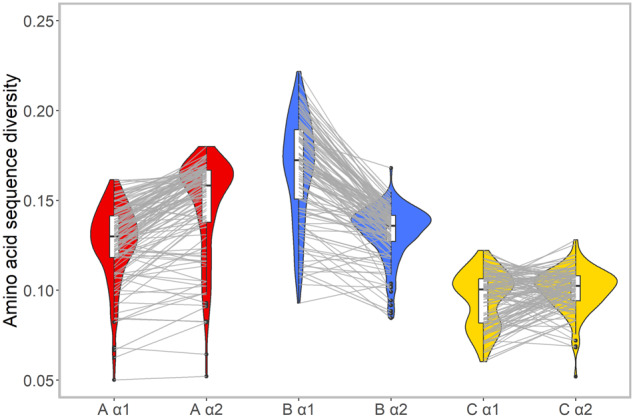
Fig. 6.

Comparison of amino acid diversity between the α1 and α2 domains of HLA-A (red), HLA-B (blue), and HLA-C (yellow) molecules in 123 populations. For each domain of each gene, the density distribution of the HLA acid amino density estimated for all populations is visualized by a Violin chart and the interdomain relationship of the diversity for each population is further indicated using gray lines linking the corresponding value points.
