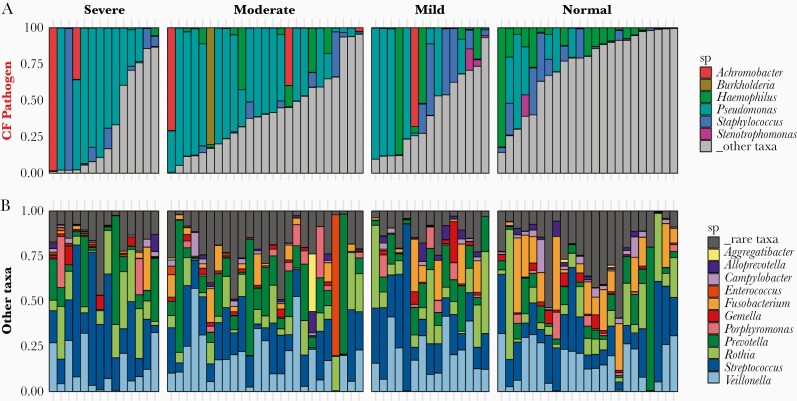
Figure 2.
CF lung microbiome composition varies with lung function and pathogen dominance. Relative abundances of (A) 6 canonical CF pathogens and (B) other taxa (grey bar taxa in (A)). Microbiome compositions grouped by disease severity, classified by ppFEV1 score: normal (80+), mild (60–80), moderate (40–60), and severe (<40). Abbreviations: CF, cystic fibrosis; ppFEV1, percent predicted forced expiratory volume in 1 second; sp, species.

