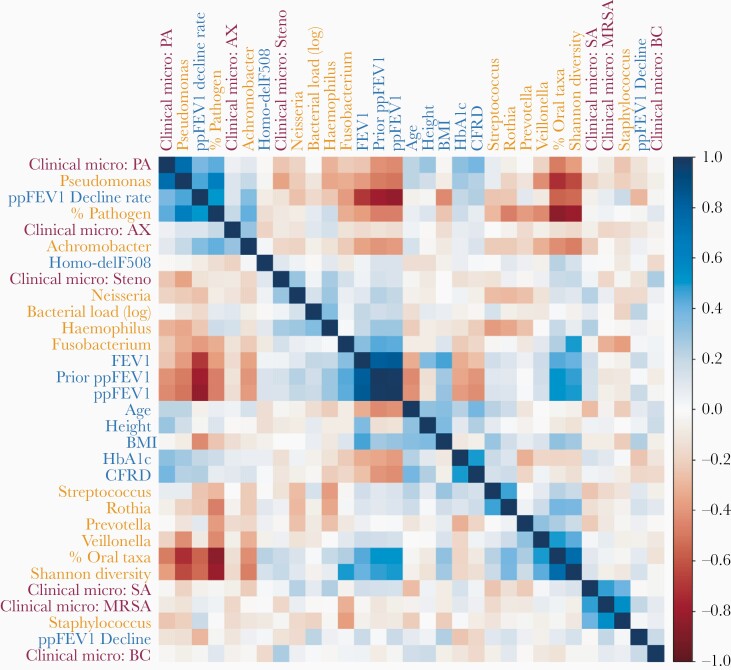
Figure 3.
Lung function varies with patient metadata. Spearman correlations (R::corrplot) across all patient metadata (blue), clinical microbiology results (maroon), and microbiome data (orange, centered log-ratio transformed) reveal a complex correlation structure. We used a centered-log transform on 16S data to mitigate compositional effects. Rows and columns were ordered by hierarchical clustering, which identified clusters of metadata and microbiome variables with similar correlation patterns. Abbreviations: AX, Achromobacter; BC, Burkholderia; BMI, body mass index; CFRD, cystic fibrosis-related diabetes; MRSA, methicillin-resistant Staphylococcus aureus; PA, Pseudomonas aeruginosa; ppFEV1, percent predicted forced expiratory volume in 1 second; SA, Staphylococcus aureus.

