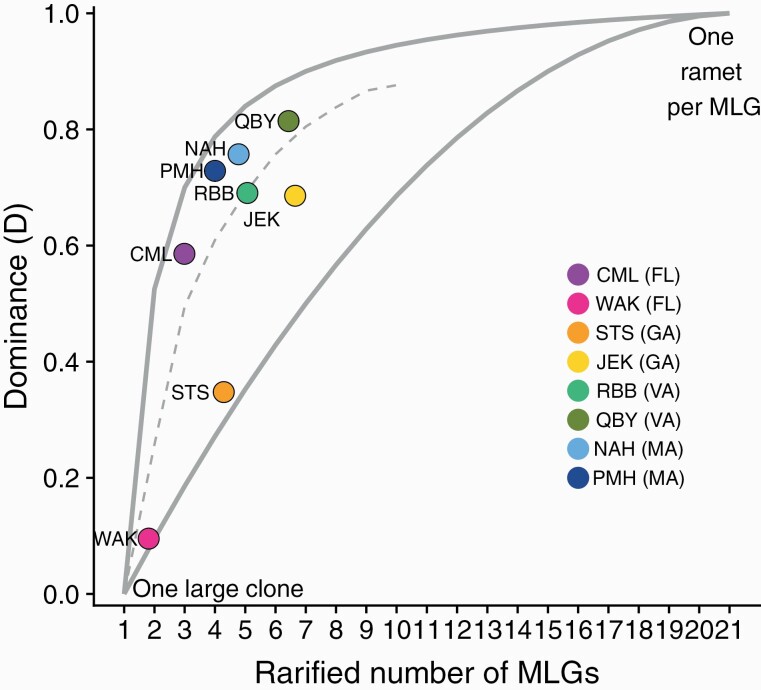
Figure 3.
Contribution of clonality to D. lineata populations at 8 sites across the North American Atlantic Coast. Clonal dominance (Drare) normalized to rarified genotypic richness, reflects the relative diversity of MLGs at a site. Low values occur at sites dominated by a few large clones. High values occur where all MLGs are represented evenly. Where D = 1, every MLG is represented by a single individual. Solid upper and lower lines indicate maximum and minimum Drare possible for a given MLG richness. Dotted line is the median Drare expected if the number of ramets per genet is random within each level of genotypic richness. Point color indicates site. State code in parentheses indicates the region of origin.

