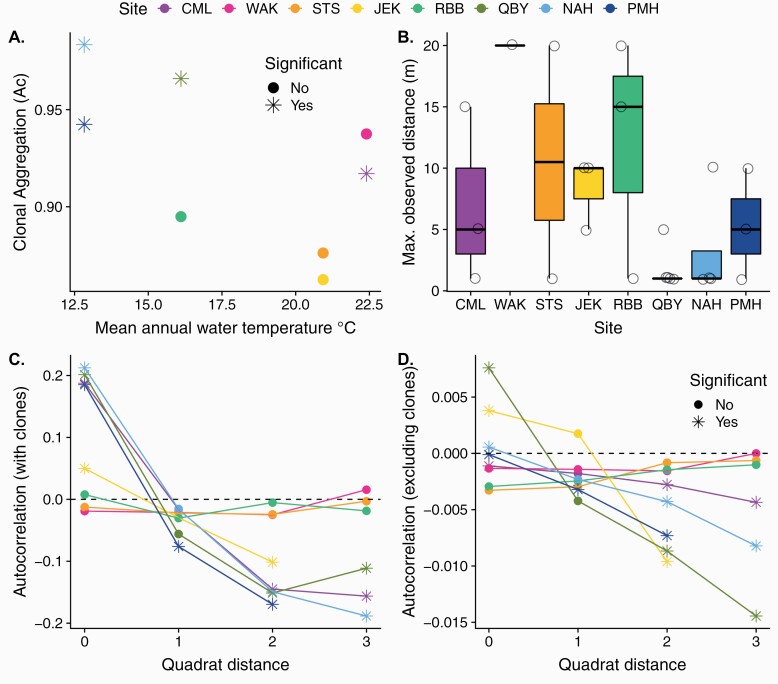
Figure 5.
Spatial patterns in the distribution of ramets. (A) The average level of clonal aggregation by site over mean annual water temperature. The index Ac can range from −1 to 1 reflecting the degree of overdispersion or clustering among ramets of a genet, respectively. (B) Maximum observed distance between ramets of a genet in meters. Each point represents one genet. Boxplots indicate the median and quartile estimates. (C) The degree of spatial autocorrelation of Euclidian genetic distance (including relatedness due to clonality) among ramets in quadrats spaced along a linear transect. (D). The degree of spatial autocorrelation of Euclidian genetic distance, not including relatedness due to clonality. In A, C, and D, asterisks indicate values that are significantly different than zero (P < 0.05), which would be expected if ramets were randomly distributed. Colors indicate site of origin, arranged by increasing regional latitude.

