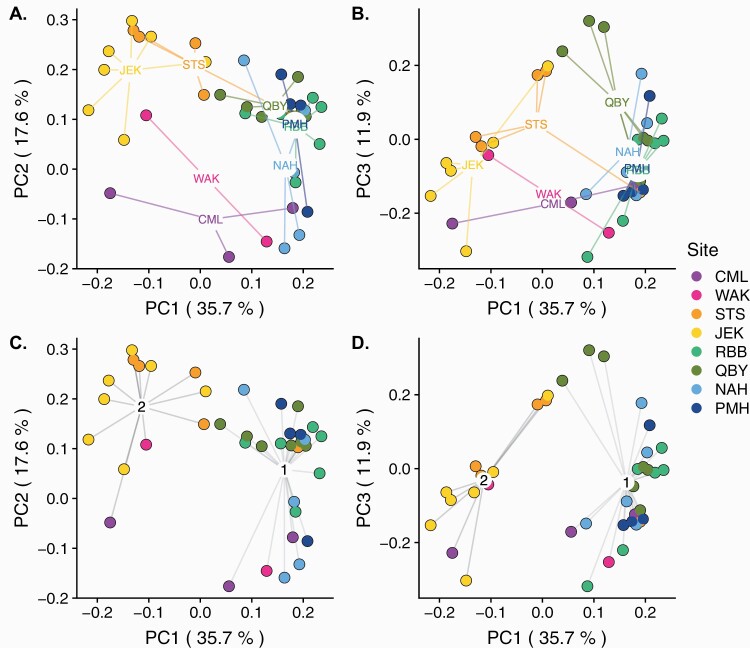
Figure 7.
Principal components of variation in genetic distance among MLGs, as assessed by Psex, among sites (colors). (A and B) show points grouped by site along (A) axis PC1 and PC2 or (B) PC1 and PC3. (C and D) show points grouped into best-fit clusters based on BIC value, as estimated with find.clusters in adegenet, along (C) axis PC1 and PC2, or (D) PC1 and PC3. Percent variance explained by each PC axes shown in parentheses. Group numbers in (C and D) are arbitrary.

