FIGURE 2.
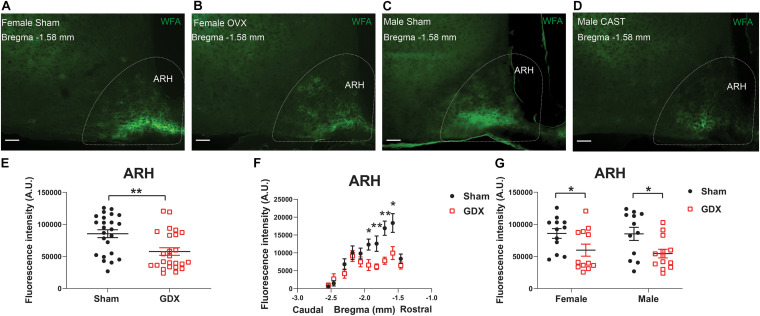
GDX reduces PNNs in the ARH. (A–D) Representative fluorescence microscopic images showing WFA-labeled PNNs (green) in the ARH of female sham (A), female OVX (B), male sham (C) and male CAST mice (D). Scale bars = 50 μm. ARH, the arcuate hypothalamic nucleus. (E) Quantification of the total WFA fluorescence intensity in the ARH from sham vs GDX mice. N = 24 or 25 mice per group. Data are presented with mean ± SEM with individual data points. **P < 0.01 in unpaired two-tailed Student’s t-tests. (F) Quantification of the WFA fluorescence intensity at various rostral-caudal levels of the ARH from sham vs GDX mice. N = 24 or 25 mice per group. Data are presented with mean ± SEM. *P < 0.05 and **P < 0.01 in unpaired two-tailed Student’s t-tests at each level. P < 0.0001 for sham vs GDX mice in 2-way ANOVA with repeated measures. (G) Quantification of the total WFA fluorescence intensity in the ARH from female or male mice with sham or GDX surgeries. N = 12 or 13 mice per group. Data are presented with mean ± SEM with individual data points. *P < 0.05 in two-way ANOVA analysis followed by Holm-Sidak post hoc tests.

