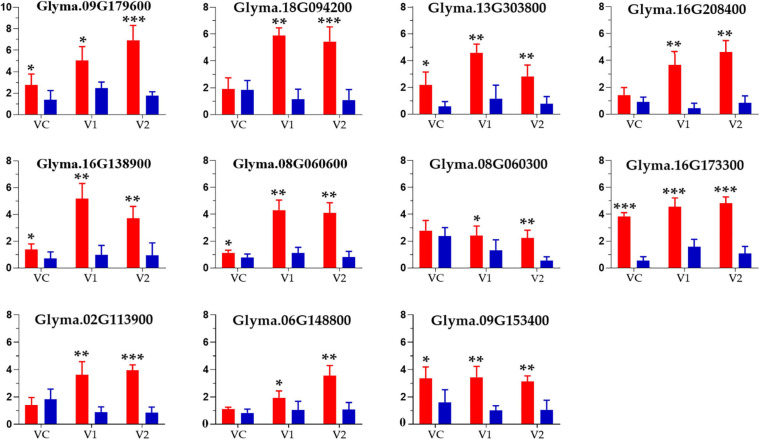
FIGURE 5.
Relative expression levels of eleven candidate genes in phenotypically different root samples from the spring soybean at three seedling stages analyzed via qRT-PCR. The red and blue bars indicate the mean expression level (for four samples) of genes in high and low branching number accessions at VC, Vl and V2 stages, respectively; ***, **, and * specify the significance at the level of P < 0.001, P < 0.01, and P < 0.05, respectively.

