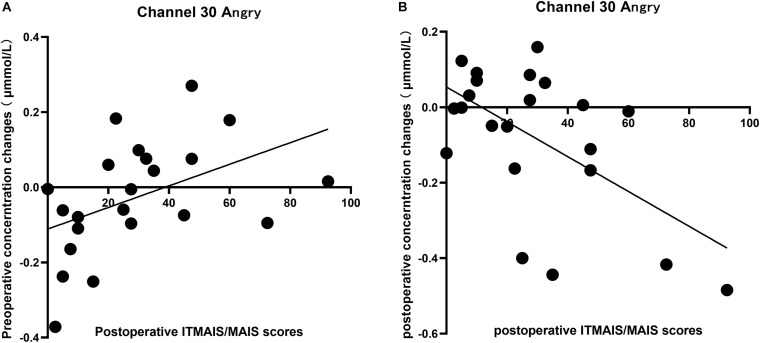
FIGURE 5.
Correlation between the changes in the cortical oxyhemoglobin response to angry vocal emotions in channel 30 (located in the right supramarginal gyrus of Wernicke’s area) and the changes in the IT-MAIS/MAIS score. (A) A positive correlation was observed between preoperative neural responses to postoperative behavioral outcomes (Pearson’s correlation coefficient, r = 0.455, p = 0.033, n = 22). (B) A negative correlation was observed between the postoperative neural responses to postoperative behavioral outcomes (Pearson’s correlation coefficient, r = −0.576, p = 0.005, n = 22).

