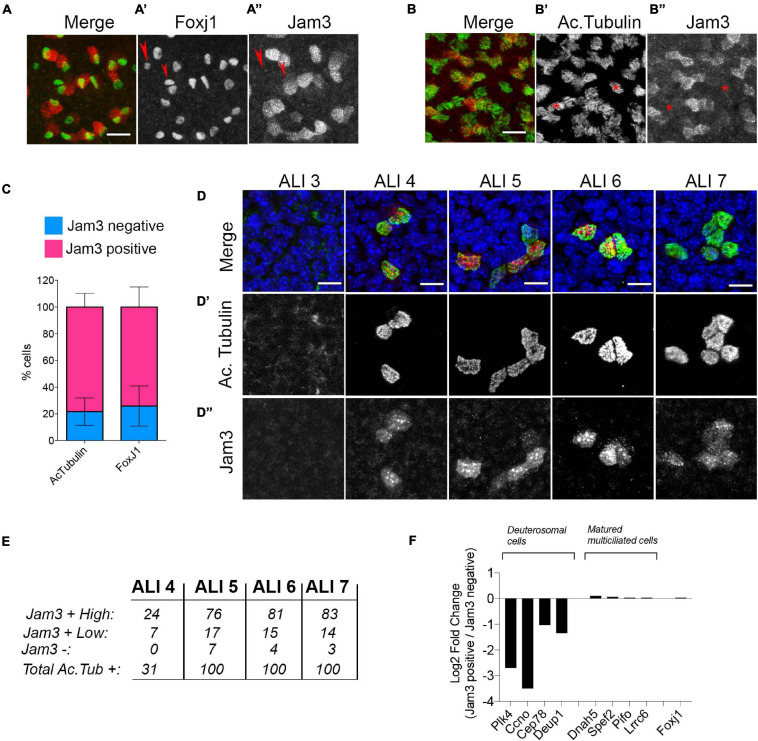
FIGURE 2.
Junctional adhesion molecule 3 (Jam3) expression is restricted to a subset of multiciliated cells. (A,B) Representative images for Jam3 and Foxj1 (A) or acetylated tubulin (B) to evaluate the co-labeling of MCCs. Foxj1 in green (gray in panel A’), and Jam3 in red (gray in panel A”) Acetylated tubulin in green (gray in panel B’), and Jam3 in red (gray in panel B”) (C) Quantification of the number of cells that express Jam3 and acetylated tubulin or Jam3 and Foxj1. (D) Set of confocal images at different days of differentiation (from ALI 3 to ALI7) for Jam3 in red (gray in panel D”), acetylated tubulin in green (gray in panel D’), and nuclei in blue. (E) Quantification of acetylated tubulin-positive cells with high levels of Jam3, low levels of Jam3, or negative for Jam3 from ALI4 to ALI7. No acetylated tubulin or Jam3-positive cells were detected in ALI3. (F) Relative gene expression levels for deuterosomal cells and mature ciliated cell markers in Jam3-positive or negative cells (all of them are Foxj1-positive cells). Scale bar in panels (A,B) represents 20 and 10 μm in panel (D). Red arrow pointed Foxj1 positive cells which are Jam3 negative. Red starts marked Ac-tubulin positive cells which are Jam3 negative.

