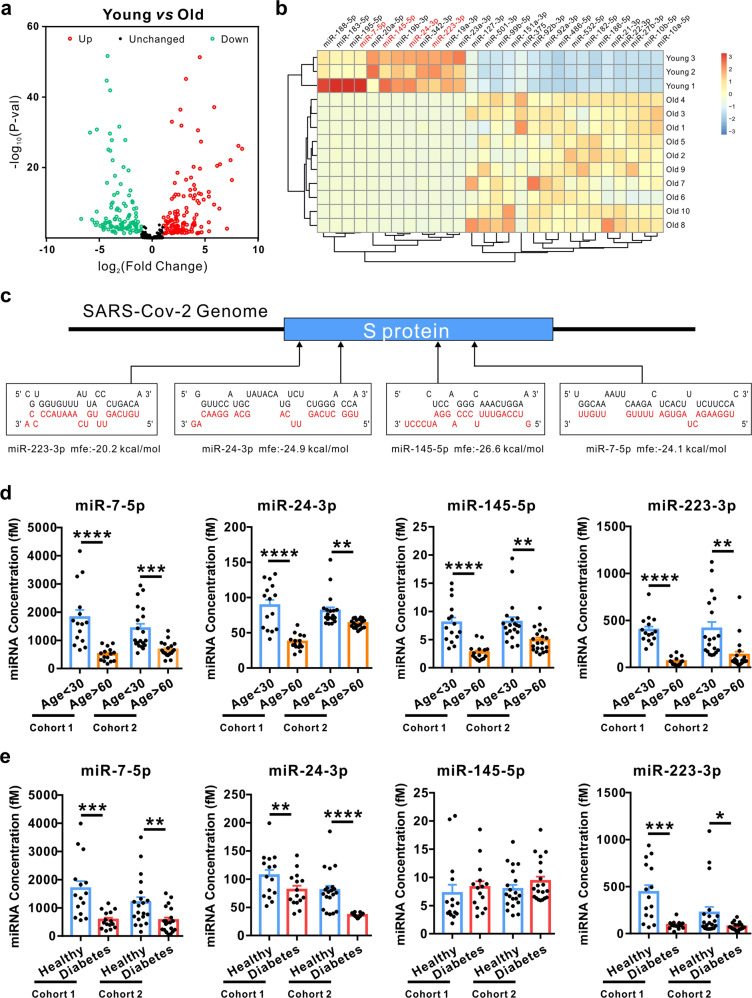
Fig. 1.
Circulating miR-7, 24, 145 and 223 were decreased in elderly people and people with diabetes. a Scatter plot comparison illustrating circulating miRNAs that are differentially expressed between the young and old groups. For comparison of miRNAs, reads were normalized to reads per million (RPM). The analysis of differentially expressed miRNAs used a stringent threshold and a significance criterion of P < 0.05 and log2-fold change > 1 (young group: n = 3; old group: n = 10). b Hierarchical clustering indicates significant differences in miRNA expression profiling between the young and elderly groups with stricter criteria of mean reads >50, P < 0.01 and fold change > 10 (young group: n = 3; old group: n = 10). c Schematic diagrams of the predicted interaction between upregulated miRNA in the young group and S protein in the SARS-CoV-2 genome. The miRNA sequences are indicated in red. d, e The expression of four serum miRNAs in individual serum samples. Serum samples from 15 young people and 15 elderly people (d), 15 healthy people and 15 diabetic patients (e) were collected from The Affiliated Drum Tower Hospital of Nanjing University (Cohort 1) and 20 young people and 20 old people (d), 20 healthy people and 20 diabetic patients (e) were collected from Nanjing Jiangning Hospital (Cohort 2). All samples were subjected to qRT-PCR for absolute quantification. Data are shown as means ± SEMs. Statistical significance was assessed using the two-tailed unpaired Student’s t-test. *P < 0.05; **P < 0.01; ***P < 0.001; ****P < 0.0001

