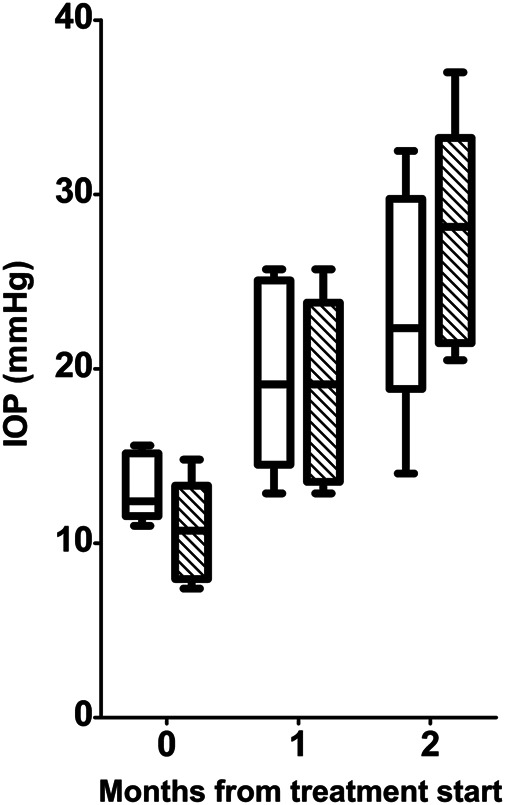
FIGURE 1.

Longitudinal analysis of IOP levels in D2 (white boxes) and D2+LG (dashed boxes). Box plots describe the statistical distribution of data deriving from the average of IOPs measured in individual right and left eyes of n = 6 mice. Statistical differences were tested using two-way ANOVA with Bonferroni post-hoc test. The effect of time was highly significant (p < 0.0001), while the effect of LG at each time was not significant (p = 0.6782).
