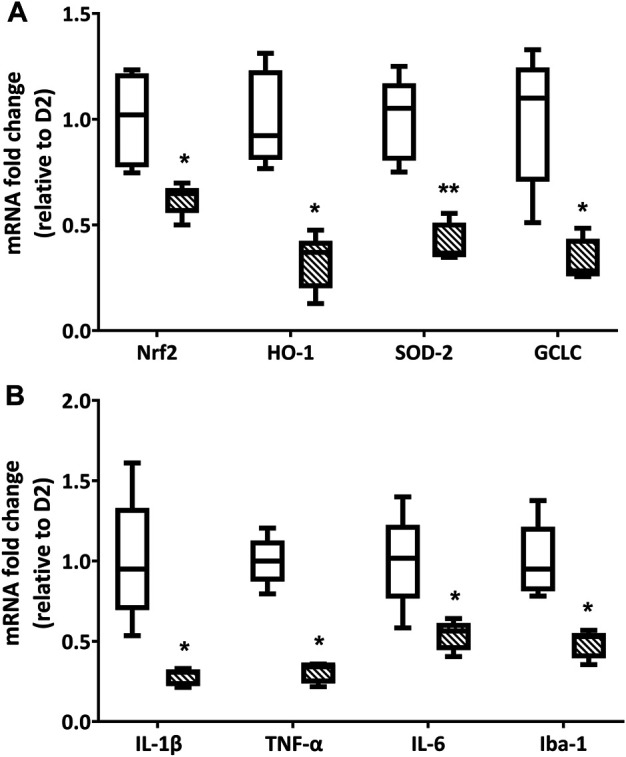
FIGURE 3.

Endpoint qPCR analysis for the expression of oxidative stress (A) and inflammation-related (B) markers in D2 (white box) and D2+LG (dashed boxes) groups after 2 mo of treatment. Box plots describe the statistical distribution of n = 6 independent retinas. Differences between groups were tested using two-tailed t-test. *p < 0.05, **p < 0.01 vs D2.
