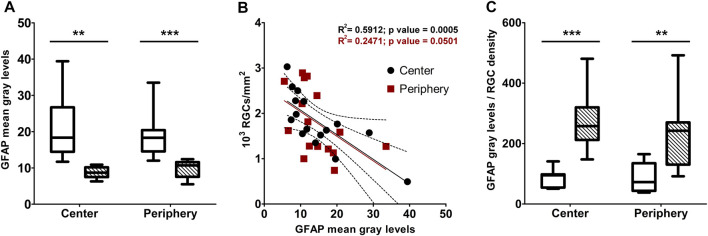
FIGURE 6.
(A) densitometric analysis of GFAP immunostaining in central and peripheral areas of D2 (white box) and D2+LG (dashed boxes). (B) correlation of GFAP immunofluorescence levels with the correspondent RGC density per optical filed in central and peripheral retinal areas. (C) ratio between GFAP immunostaining and RGC density in central and peripheral retinal areas of D2 (white box) and D2+LG (dashed boxes) mice. Box plots describe the statistical distribution of n = 4 independent retinas. Data were analyzed using two-way ANOVA with Bonferroni post-hoc test. **p < 0.01, ***p < 0.001.

