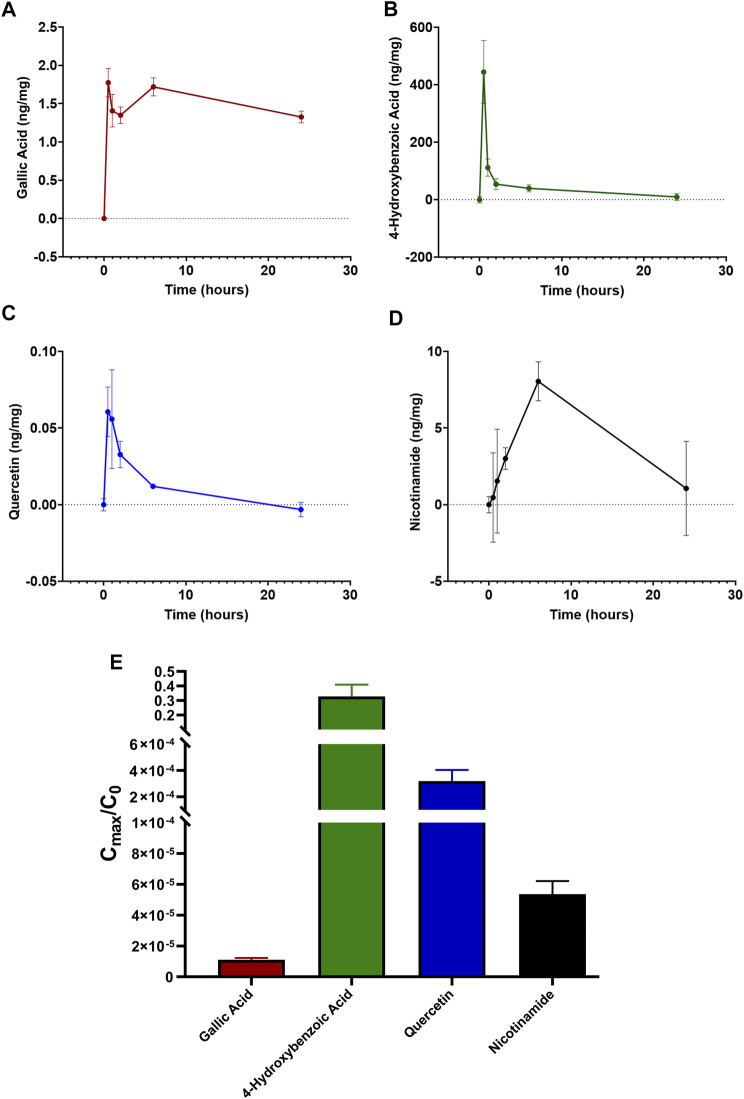
FIGURE 7.
Time-dependent retinal profile of gallic acid (A), 4-hydroxybenzoic acid (B), quercetin (C), and nicotinamide (D) amount after administration of 1 mg LG by oral gavage. (E) corresponding ratios calculated as the maximal amount of each compound reaching the retina (Cmax) divided by the initial amount of the same compound administered in 1 mg of LG (C0). Data are expressed as mean ± SEM of n = 3 independent samples.

