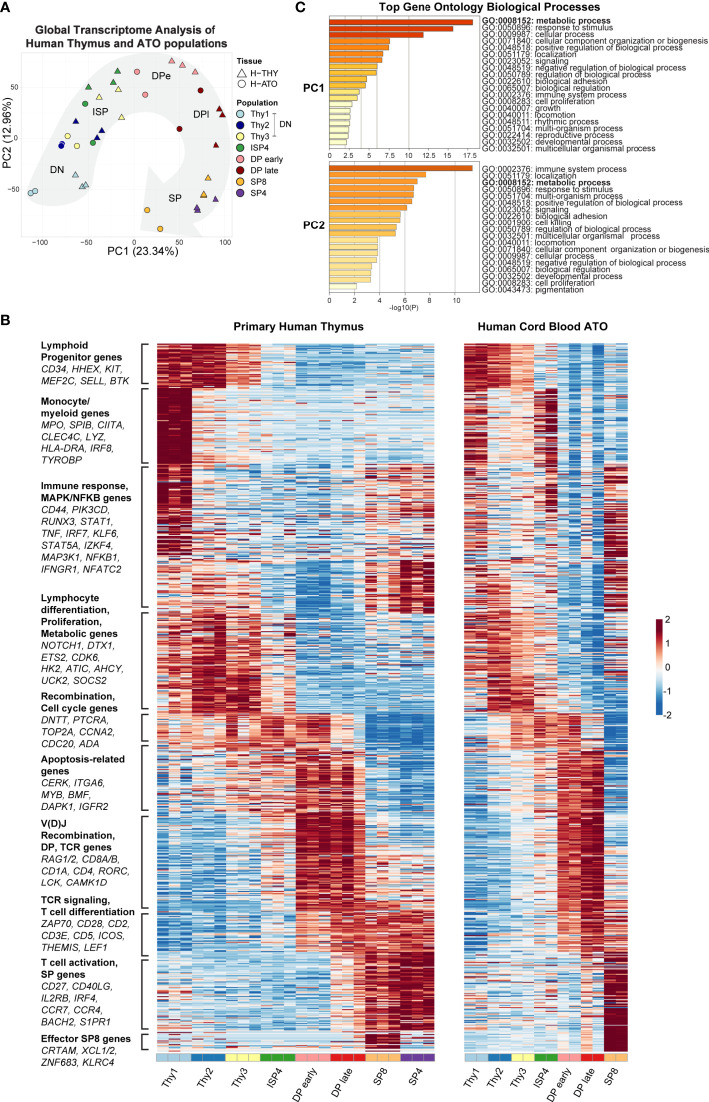
Figure 2.
(A) Principal-component analysis (PCA) of gene expression for human thymic and H-ATO-derived populations. PC1 and PC2 are shown along with the percentage of gene expression variance explained. Clustering was obtained with data from all detected genes without additional filters. Population phenotypes from each source are provided in Supplementary Table 1. SP4 population was not collected from H-ATO. Background arrow shows direction of differentiation. (n=3 independent replicates for H-THY; n=2 for H-ATO) (B) Hierarchical model-based clustering of 769 highly variable genes classified as differentially expressed (Wald adjusted p value < 0.01, fold change > 4) within and between human thymic and ATO-derived populations. The x axis indicates populations isolated for analysis. Each heatmap represents z-scores of normalized variance-stabilized gene expression data. To summarize the unsupervised hierarchical clustering results, we highlight for each cluster an ontology annotation significantly associated with genes overrepresented in each cluster, along with manually selected genes known to be involved in T cell development. The full list of genes as ordered in the heatmap is provided in Supplementary Table 2. (n=3 independent replicates for H-THY; n=2 for H-ATO). (C) Top GO terms significantly enriched in PC1 and PC2.

