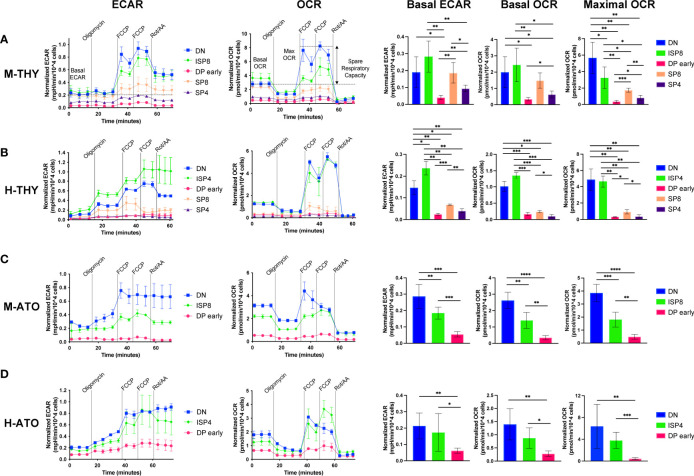
Figure 4.
(A–D) Extracellular flux analyses of thymocyte populations in (A) M-THY, (B) M-ATO, (C) H-THY, and (D) H-ATO. ECAR (left) and OCR (right) measurements are displayed for each time point over the course of several pharmacologic agents: oligomycin, FCCP, and Rotenone/Antimycin (Rot/AA). Line plots on the left show one representative experiment out of n=6 independent experiments in M-THY; n=6 M-ATO; n=3 H-THY (except for ISP4: n=2); n=6 H-ATO (except for ISP4: n=5). Symbols and error bars represent mean +/- sd for 2-4 technical replicates (wells). Measurements are normalized to cell number per well. The bar graphs on the right consist of aggregated data from all experiments. Basal ECAR, basal OCR, and maximal OCR for each population were calculated as detailed in the methods and compared. (error bars: sd, significance: multiple t-test p values *p < 0.05; **p < 0.01, ***P < 0.001, ****P < 0.0001).

