Figure 5.
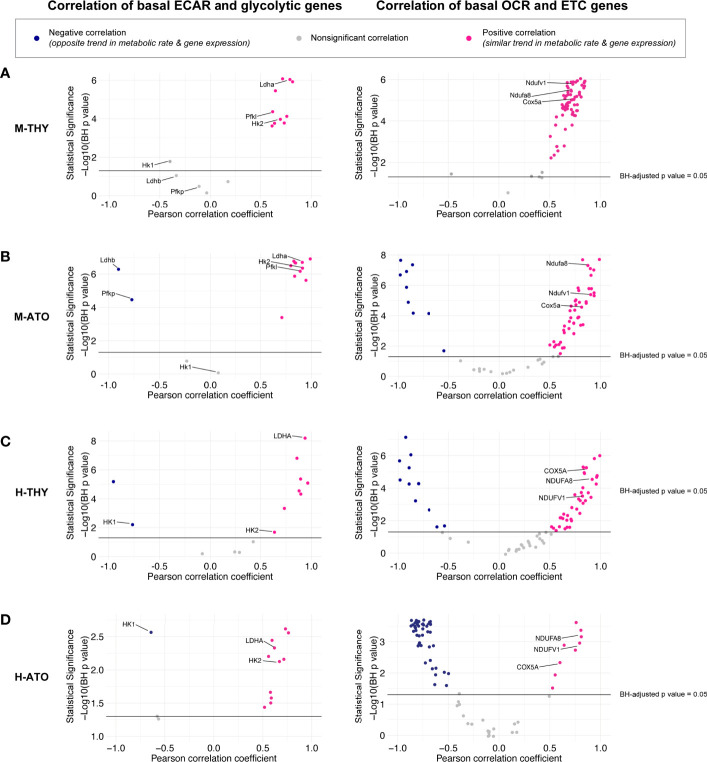
(A–D) Scatter plots show correlation between (left) glycolytic enzyme gene expression and basal glycolysis (ECAR), or (right) correlation between electron transport chain gene expression and basal respiration (OCR) in (A) M-THY, (B) M-ATO, and (C) H-THY, and (D) H-ATO. The x axis represents the Pearson correlation coefficient R values calculated for individual genes within the specified metabolic pathway for all cell populations for which respective extracellular flux data was collected. The y axis represents the statistical significance of each R value using -log10 of Benjamini-Hochberg adjusted p-values. Solid black line indicates an adjusted p-value of 0.05; all R values above the line are statistically significant. Genes with R values >0.5 (pink) are positively correlated with metabolic flux data, while genes with R values <-0.5 (blue) are negatively correlated with metabolic flux data. Nonsignificant or weak correlation R values >-.05 or <0.5 are indicated in grey. Certain genes of interest are indicated. (M-THY: n=6 flux analysis values for 5 populations, n=2 RNA-seq replicates; H-THY: n=3 flux analysis values for 5 populations, n=3 RNA-seq replicates; M-ATO: n=6 flux analysis values for 3 populations, n=2 RNA-seq replicates; H-ATO: n=6 flux analysis values for 3 populations, n=2 RNA-seq replicates).

