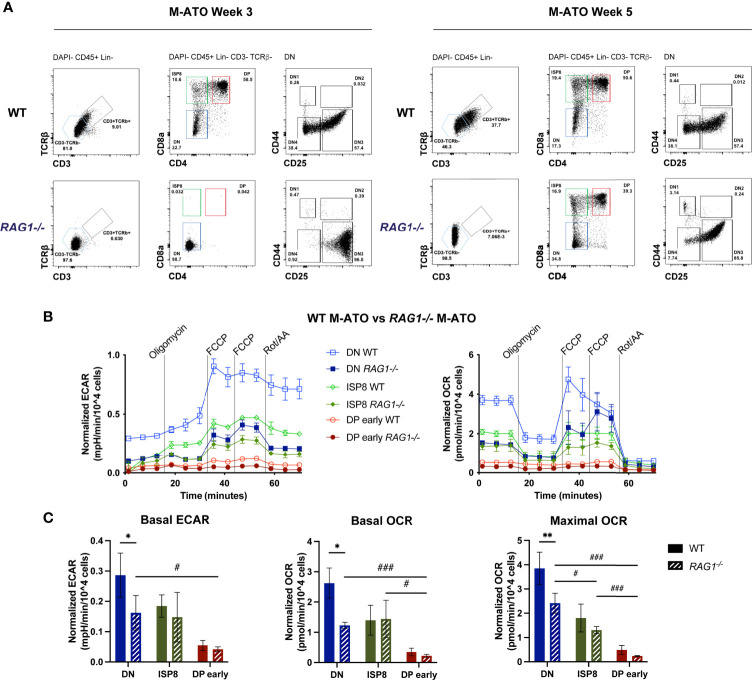
Figure 7.
(A) Representative flow cytometry analysis of thymocyte populations from Week 3 and 5 M-ATOs derived from WT and Rag1-/- mouse bone marrow. (B) Extracellular flux analyses of thymocyte populations from Week 3 M-ATOs derived from WT or Week 5 M-ATOs derived from Rag1-/- mouse bone marrow HSPCs. (C) Comparison of basal ECAR, basal OCR, maximal OCR, between thymocyte populations from M-ATOs derived from WT or Rag1-/- bone marrow HSPCs. (WT: n=6, Rag1-/-: n=3 independent experiments). (error bars: sd, significance: multiple t-test p values, comparisons between WT and Rag1-/- ATO populations denoted by *; comparisons between Rag1-/- ATO populations denoted by . * or #p < 0.05; ** or ##p < 0.01; *** or ###p < 0.001).

