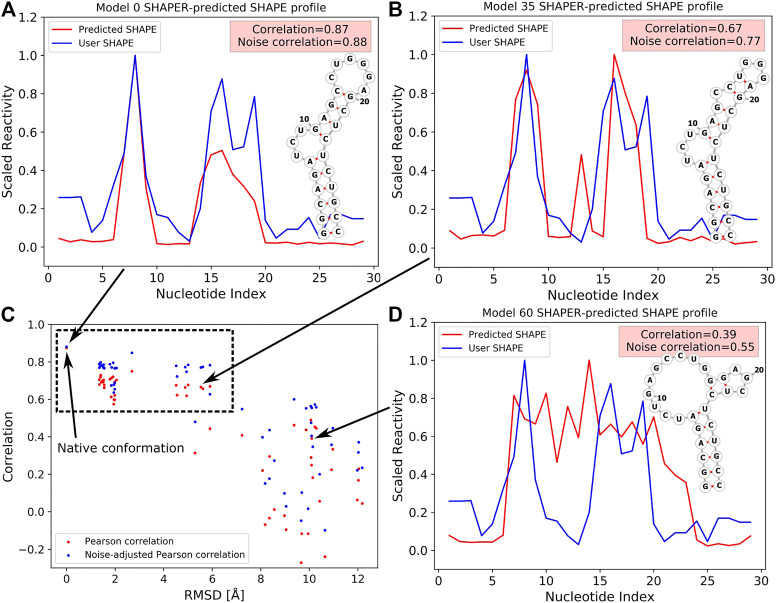
FIGURE 3.
SHAPE profiles for native (A) and selected decoy (B,D) conformations at different RMSDs. Predicted and experimental (i.e., User SHAPE) profiles are shown in red and blue curves, respectively. 2D structure in (A) corresponds to the native structure, and 2D structures shown in (B,D) were used as constraints to run the simulations. (C) The relation between PC/noise-adjusted PC (red/blue) and RMSDs relative to the native structure for 60 tested conformations (include the native structure, PDB code: 2L8H). The data point of the native conformation is shown on the top left of (C) and pointed out by an arrow.

