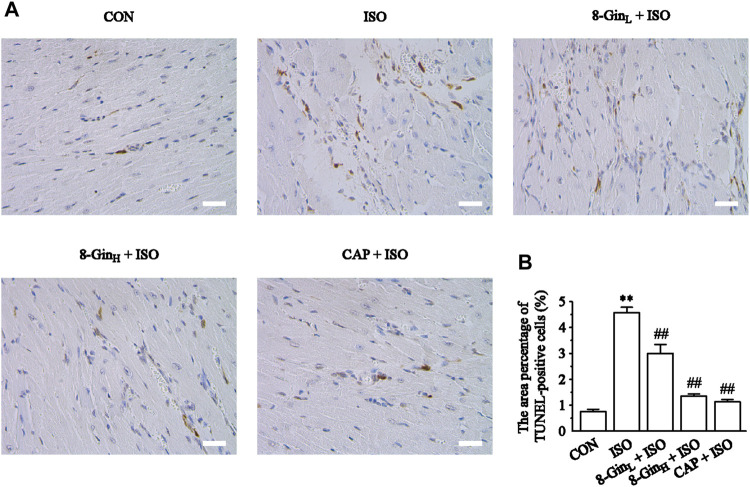
FIGURE 6.
Effects of 8-Gin on TUNEL staining. (A) Representative TUNEL staining of cardiac sections from each group (magnification × 400, scale bar = 50 μm). (B) The area percentages of TUNEL-positive cells were shown. Data are shown as the mean ± SEM, n = 5. ** p < 0.01 vs. the CON group; ## p < 0.01 vs. the ISO group.

