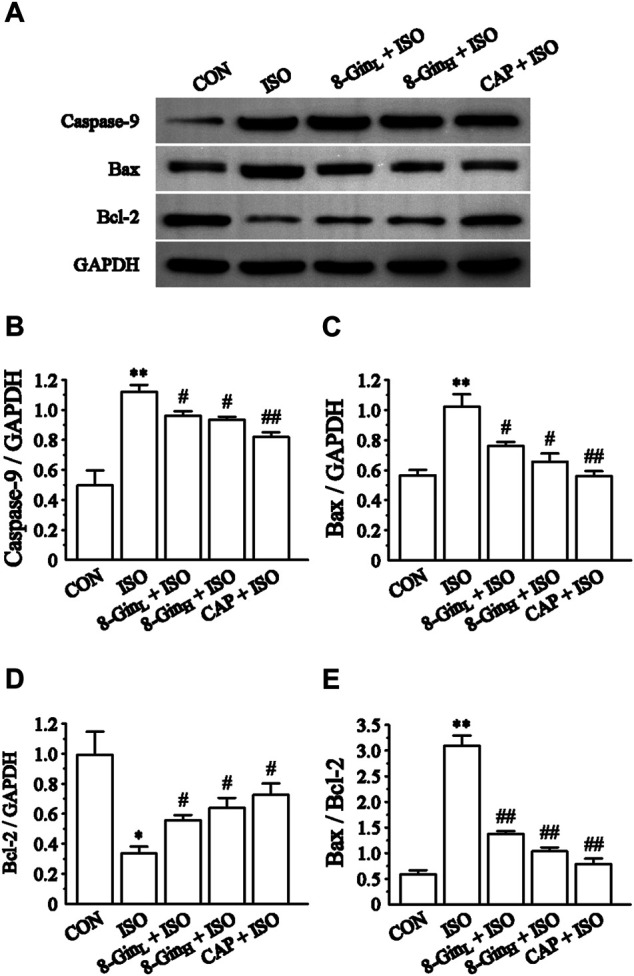
FIGURE 9.

Effects of 8-Gin on the expression of Caspase-9, Bax, Bcl-2 protein. (A) Representative images of Caspase-9, Bax, Bcl-2 protein expression that were exhibited from cardiac tissue in the CON, ISO, 8-GinL + ISO, 8-GinH + ISO, and CAP + ISO groups. (B–D) Pooled analysis of Caspase-9, Bax, Bcl-2 protein expression by western blot analysis on which intensity was normalized to GAPDH. (E) The ratio of Bax and Bcl-2 protein expression by western blot analysis. Data are shown as the mean ± SEM, n = 3. * p < 0.05, ** p < 0.01 vs. the CON group; # p < 0.05, ## p < 0.01 vs. the ISO group.
