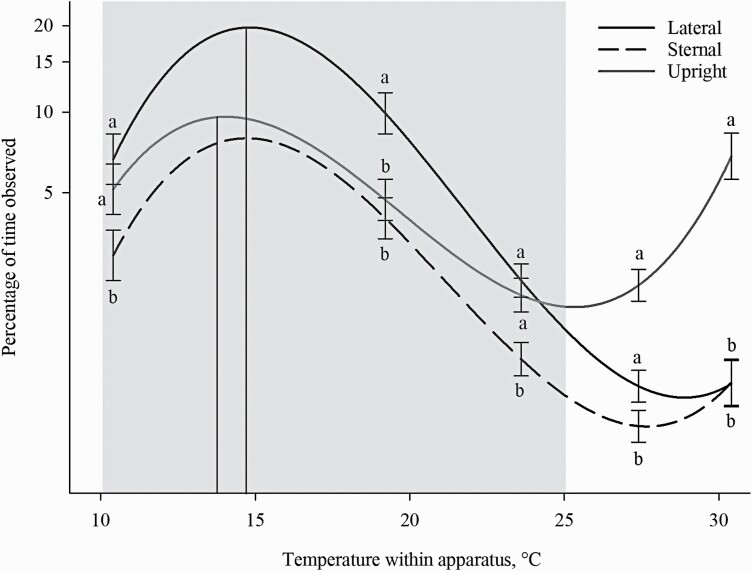
Figure 5.
Percentage of observations in different temperatures within the thermal gradient based on posture. Data are plotted by postures: lateral and sternal lying, and upright. Temperature within the thermal apparatus is plotted on the x-axis, and the percentage of time observed is plotted on the y-axis as a log10 + 0.001 scale. Cubic peaks are indicated by solid vertical lines. Standard error bars are located at the temperatures of the five thermal zones (10.4, 19.2, 23.6, 27.5, and 30.5 °C). Different letters denote significant Tukey pairwise comparisons (P < 0.01). The gray box indicates the recommended temperatures (10 to 25 °C) for sows or boars > 100 kg (Federation for Animal Science Societies, 2020).

