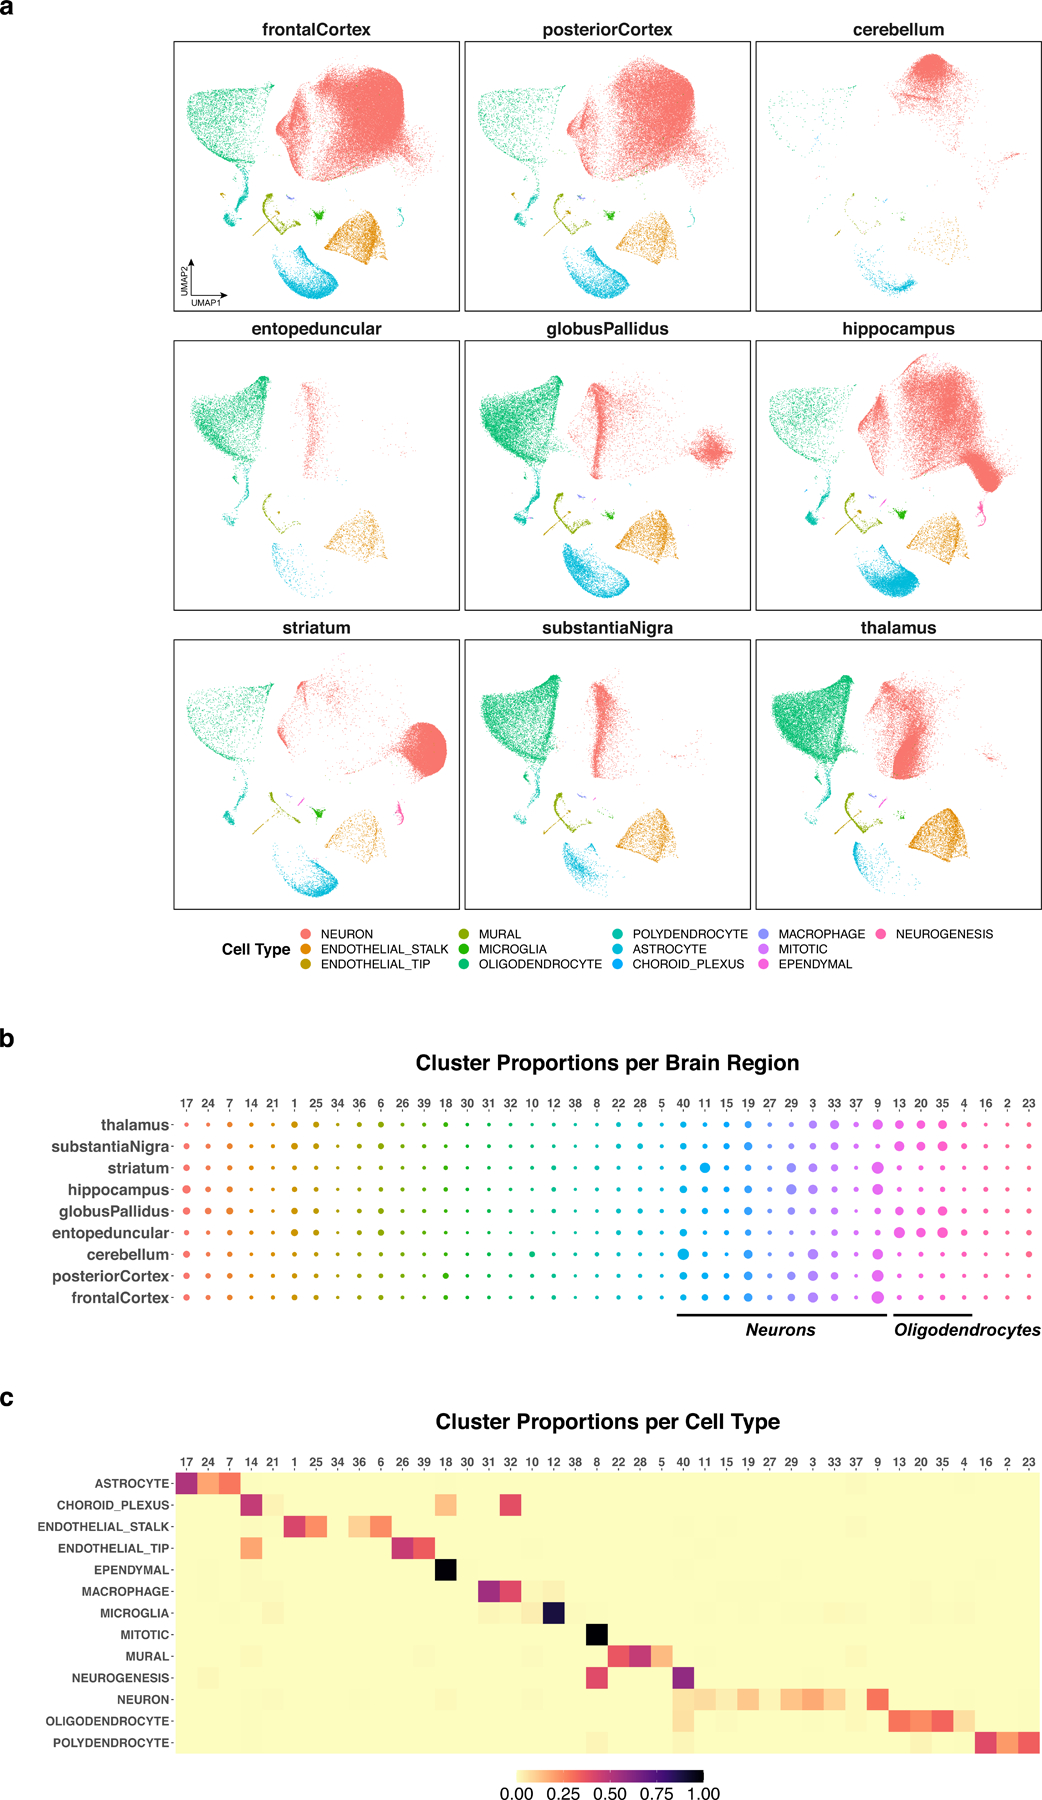
Figure 4. Joint analysis of nine regions of the adult mouse brain using online iNMF.

a, UMAP visualization of the iNMF factors learned for each brain region, colored by published cell class. b, Dot plot showing the proportion of each of 40 clusters inferred from iNMF in each brain region. c, Proportion of cells from each cluster in every cell type. The cells in each cluster mostly correspond to a single cell type.
