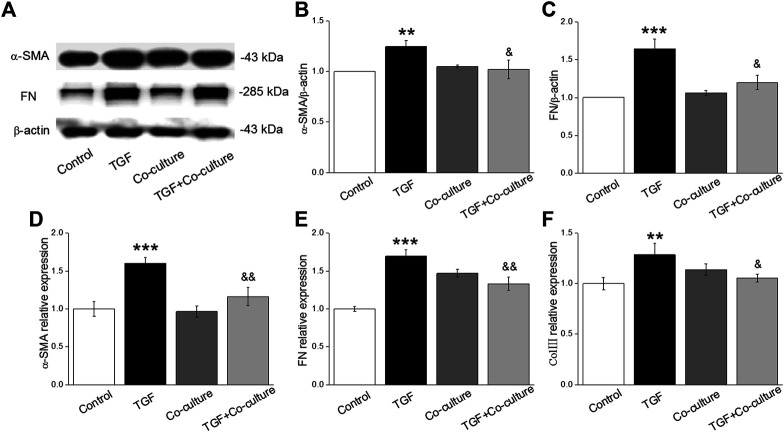
FIGURE 1.
TGF-β1 treatment enhances the level of fibrotic-related protein/mRNAs and BMSCs reverse the above expression in MLg. (A) Representative bands of α-SMA and FN protein expression by Western blot in MLg treated with TGF-β1 for 24 h and/or co-cultured with BMSCs for 24 h (B,C) Statistical analyses were showed with relative gray values of the protein bands (α-SMA/β-actin and FN/β-actin). (D-F) Representative statistical analysis of α-SMA, FN and Col III mRNA by qRT-PCR (α-SMA/GAPDH, FN/GAPDH and Col III/GAPDH). Data were presented as mean ± SE, ** p < 0.01, *** p < 0.001, compared with Control group. & p < 0.05, && p < 0.01, compared with TGF group. n = 3–6.

