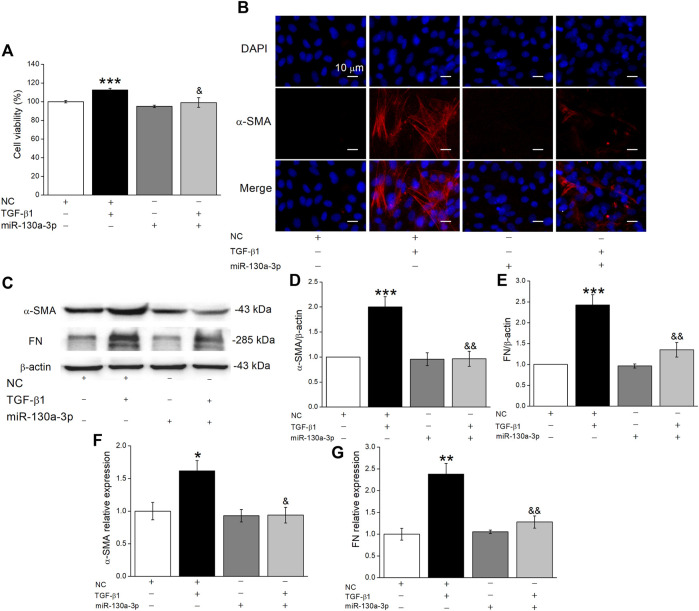
FIGURE 4.
The effect of miR-130a-3p on the differentiation in TGF-β1-induced MLg. (A) The relative cell viability was measured in CCK8 assay, and the data for NC group was set to 100%. (B) The effect of miR-130a-3p on fibroblast-myofibroblast transition was measured with immunofluorescence. Scale bar = 10 μm. (C) Western blot bands of α-SMA and FN protein expression in MLg after transfection of miR-130a-3p. (D,E) Statistical analyses were obtained from relative gray values of the protein bands (α-SMA/β-actin and FN/β-actin). (F,G) The result of qRT-PCR assay shows the α-SMA and FN mRNA level in MLg (α-SMA/GAPDH, and FN/GAPDH). Data were presented as mean ± SE, * p < 0.05, ** p < 0.01, *** p < 0.001, compared with NC group. & p < 0.05, && p < 0.01, compared with NC + TGF group. n = 3–5.

