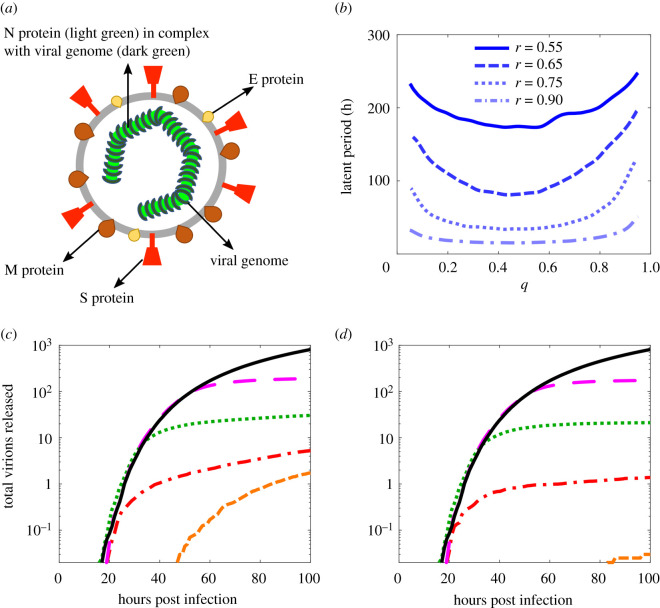
Figure 1.
An earlier treatment start, especially during the latent period, is more effective. (a) Illustration of a SARS-CoV-2 virion; the viral genome (dark green) is in complex with nucleocapsid (N) protein (light green) and is enclosed by the viral envelope that is studded by other structural glycoproteins, the spike (S) protein (red), the membrane (M) protein (maroon) and the envelope (E) protein (yellow). (b) Time lag before the release of the first virion from an infected cell; the maximal release of virions occurs when the replicase–transcriptase complex (RTC) elongation probability, r, is high and the frameshifting rate, q, is between 0.3 and 0.5. (c,d) Profiles of viral load from an infected cell after introducing treatment at different times post infection, for a concentration of 25 (c) and 50 (d) molecules of remdesivir, respectively. The black solid curve indicates the drug-free control. The magenta (long-dashed), green (dotted), red (dashed-dotted) and orange (dashed) curves correspond to a treatment start at 50, 30, 20 and 10 h post infection, respectively. Parameter values are given in electronic supplementary material, table S1.

