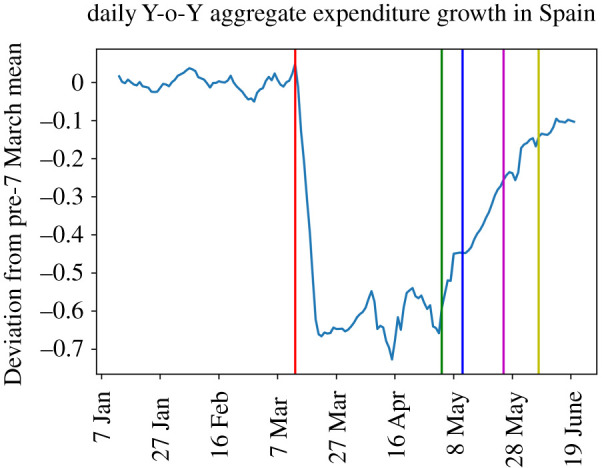
Figure 1.

Moving average (7 day, uncentred) of Y-o-Y growth of expenditure from BBVA series for Spain (aggregate). The vertical lines indicate the timing of events. The first (red) vertical line is drawn on 13 March, the day prior to the announcement of lockdown. The second one is 4 May (start of Phase 0), when easing started nationwide. The third vertical line stands for 11 May (start of Phase 1), when provinces started to differentiate in the intensity of the lockdown, some of them easing lockdown faster than others. The remaining lines are drawn on 25 May (start of Phase 2 for some provinces) and 8 June (start of Phase 3). The series is normalized by the Y-o-Y growth before 7 March.
