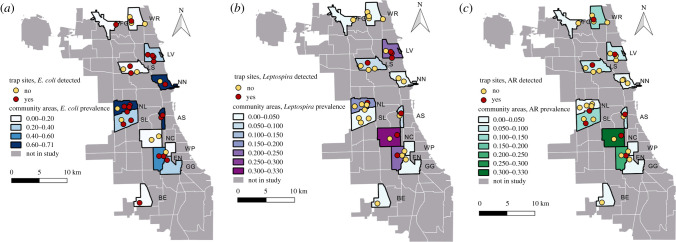
Figure 1.
Maps of study community areas (polygons) and trap sites (circles) in Chicago. Colours show the prevalence (shading) or the presence (darker circles) of rats with (a) E. coli shedding, (b) Leptospira spp. infection, and (c) anticoagulant rodenticide (AR) exposure. Abbreviations correspond to table 1.

