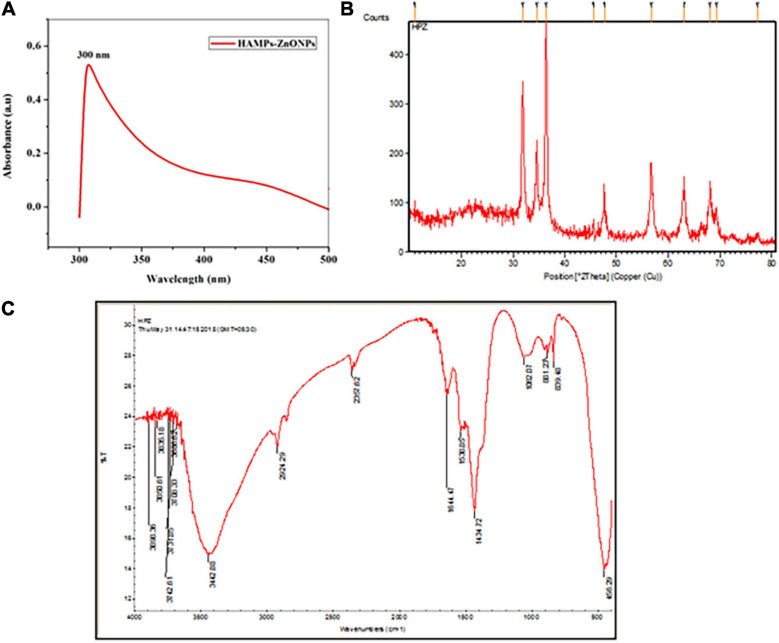
FIGURE 8.
(A) In the synthesized HAMP’s-ZnO NPs, the UV Spectroscopy spectrum shows a sharp peak at 300 nm. (B) The reflection peaks of the synthesized HAMP Zinc oxide nanoparticles can be seen in the XRD spectrum. (C) The peaks of the functional groups of the synthesized Zinc oxide nanoparticles can be seen in the FTIR spectrum.

