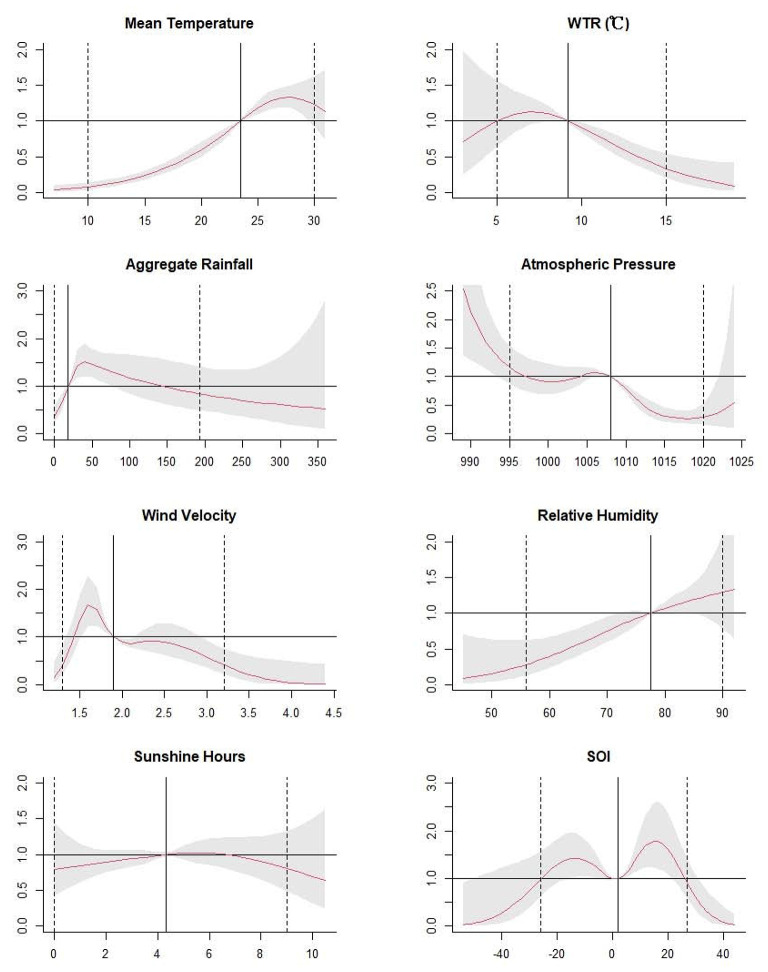
Figure 3.
The estimated overall effects of mean temperature, weekly temperature range, aggregate rainfall, atmospheric pressure, relative humidity, wind velocity and sunshine hours, and SOI over 14 weeks. The Y lab represents the value of relative risk, the X lab represents the value of relevant variables. The red lines represent mean relative risks and the gray regions represent 95% CIs. The black vertical line represents the medians of the climatic factors and the SOI, and the dotted lines represent the 2.5 percentile and the 97.5 percentile for the climatic factors and the SOI, respectively.

