Figure 4.
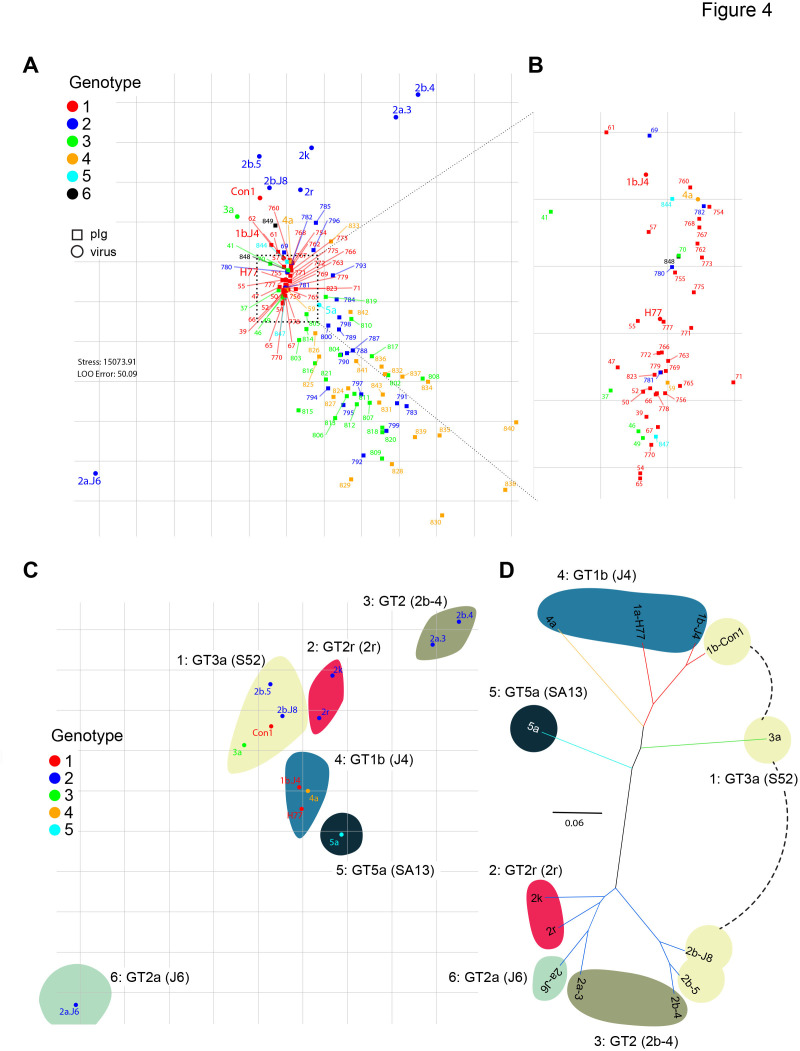
Metric multidimensional scaling of neutralisation data (104 polyclonal immunoglobulins (pIg) samples and 13 viruses). (A) Two-dimensional neutralisation map (with no normalisation and 1/Dij as weight). Viruses are drawn as coloured circles, pIg as coloured squares. (B) Magnification of central cluster. (C) Representation of only the viruses shows mapping to six neutralisation clusters. Clusters are enumerated in clockwise orientation, and reference virus for each cluster is given. (D) Phylogenetic tree of E1E2 amino acid sequences of the cell culture-derived HCV (HCVcc) screening viruses. Branches of the tree are coloured according to viral genotypes. Clouds around the virus strains are coloured according to neutralisation cluster.

