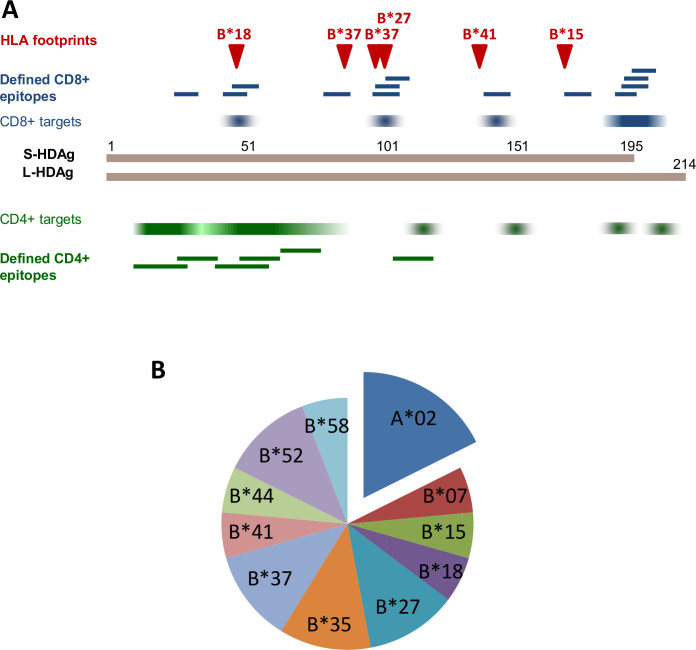
Figure 3.
HDV regions targeted by HDV-specific CD4+ and CD8+ T cell epitopes. (A) Dominantly targeted CD8+ and CD4+ epitope regions (identified in olp studies) are indicated in blue and green colour, respectively, with intensity representing frequency of recognition. Fine-mapped CD8+ and CD4+ T cell epitopes are indicated by blue and green bars, respectively. HLA class I associated HDV polymorphisms (‘HLA footprints’) that correlate to fine-mapped epitopes are depicted by red arrowheads. (B) HLA restriction of fine-mapped HDV-specific CD8+ T cell epitopes, demonstrating a clear dominance of HLA-B restriction. HDV, hepatitis D virus; L-HDAg, large hepatitis D antigen; S-HDAg, small HDAg.

