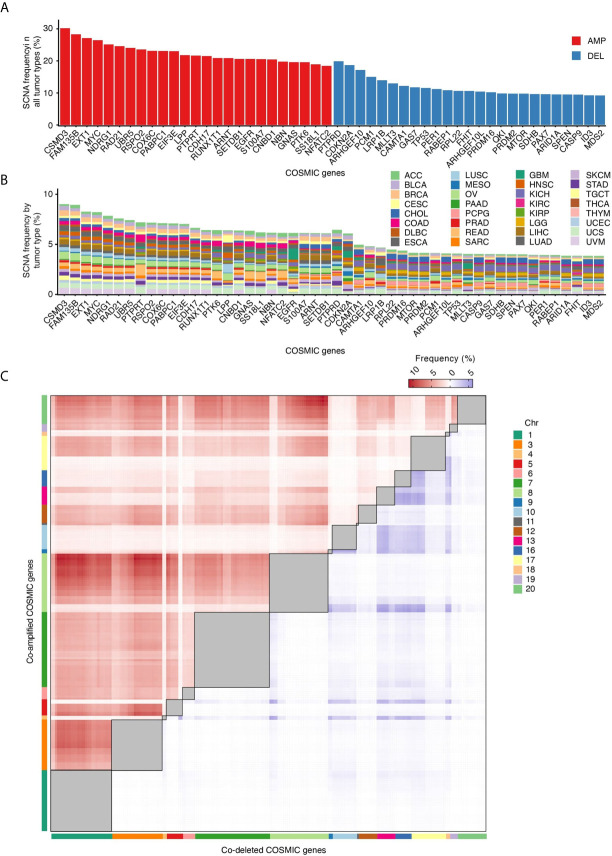
Figure 3.
COSMIC genes most frequently affected by SCNAs. (A) Percentage of all tumor types in which the 25 most frequently amplified (red) and deleted (blue) COSMIC genes are altered. (B) Percentage of tumors in which each COSMIC gene shown in (A) is altered in each of the 32 tumor types analyzed. (C) Frequency of COSMIC gene pairs that are either co-amplified (red) or co-deleted (blue) in at least 5% of all the 10,729 tumors analyzed. Intra-chromosomal pairs, which are the majority, are masked (grey squares) to make the inter-chromosomal pairs visible. The full list of inter-chromosomal pairs (including AMP-DEL events) sorted by tumor type is available in Supplementary Table 2.

