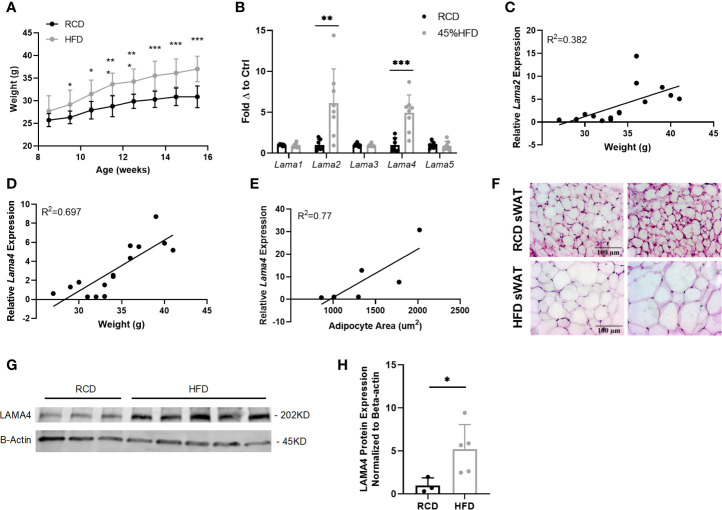
Figure 1.
Gene expression of laminin-α chains in sWAT of HFD fed mice. (A) Average weekly weights of mice on regular chow diet (RCD) and 45% High Fat Diet (HFD) for 8 weeks. RCD (n=7), HFD (n=8). (*,**,***) indicates p < 0.05, 0.01, 0.001, respectively. Data are Means ± SD. (B) Laminin-α chain mRNA expression in sWAT of mice after 8 weeks of dietary study normalized to the average of RCD control group. RCD (n=7), HFD (n=8). (C) Relative Lama2 mRNA expression normalized to RCD group graphed against weight (grams) for each mouse in 8-week dietary study (n=15). Simple linear regression analysis. (D) Relative Lama4 mRNA expression graphed against weight (grams) for each mouse in 8-week dietary study (n=15). Simple linear regression analysis. (E) Relative Lama4 mRNA expression graphed against adipocyte area (um2) for one cohort of HFD and RCD mice (n=6). Simple linear regression analysis. (F) Representative images of H&E stained sWAT tissue sections of HFD and RCD mice after 8 weeks of dietary study. All images are 40X magnification. (G) Protein expression of LAMA4 and loading control B-actin in sWAT of mice placed on RCD or 45% HFD for 8 weeks was assessed by western blot. Original blot images can be found in the supplementary file. (H) LAMA4 signal from the western blot was quantified and normalized to the loading control signal. Values are shown as fold changes in comparison to the average of the RCD group. RCD (n=3), HFD (n=5).

