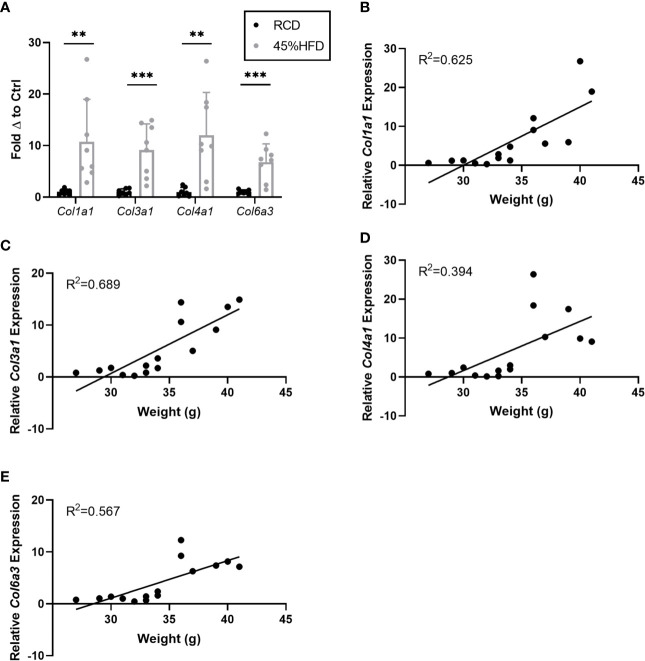
Figure 2.
Gene expression of collagen species in sWAT of HFD fed mice. (A) Collagen species mRNA expression in sWAT of mice after 8 weeks of dietary study normalized to the average of RCD control group. RCD (n=7), HFD (n=8). (**,***) indicates p < 0.01, 0.001), respectively. Data are Means ± SD. (B–E) Relative Col1a1 mRNA expression normalized to RCD group graphed against weight (grams) for each mouse in 8-week dietary study (n=15). Simple linear regression analysis.

