Figure 6.
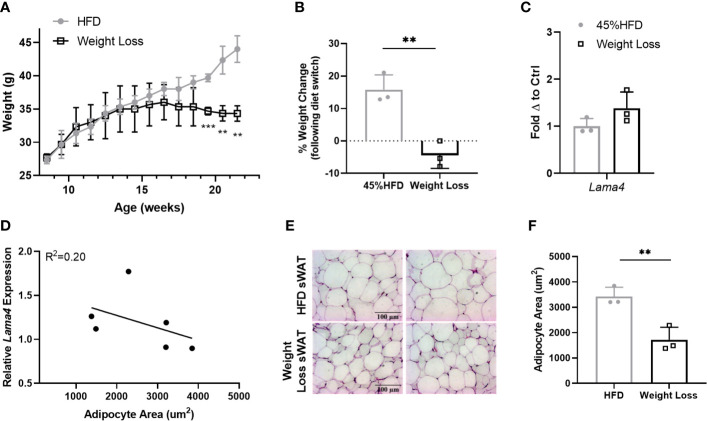
LAMA4 expression does not change following HFD feeding reversal in mice. (A) Average weekly weights of mice on 45% HFD for 14 weeks (HFD) or 45% HFD for 8 weeks and then RCD for 6 weeks. HFD (n=3), Weight Loss (n=3), (**,***) indicates p < 0.01, 0.001, respectively. (B) Weight change shown as percentage from timepoint of diet switch (16 weeks of age) until end of dietary study (22 weeks of age). Data are Means ± SD. (C) Lama4 mRNA expression in sWAT of mice in HFD (n=3) or Weight Loss (n=3) group. (D) Relative Lama4 mRNA expression graphed against adipocyte area (um2) (n=6). Simple linear regression analysis. (E) Representative images of H&E stained sWAT tissue sections of HFD and Weight Loss group mice after 14 weeks of dietary study. All images are 40X magnification. (F) Adipocyte area (um2) in sWAT of mice in HFD (n=3) and Weight Loss (n=3) group.

