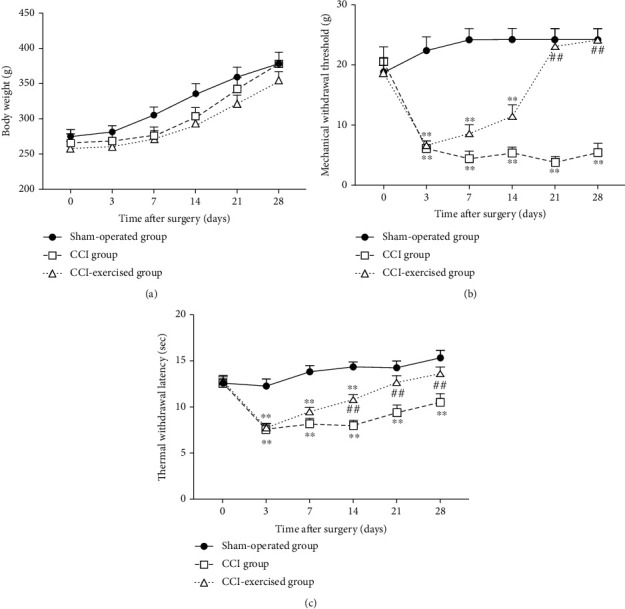
Figure 3.

Body weight and nociceptive behavior in different time courses. (a) Time courses of body weight, (b) mechanical withdrawal threshold, and (c) thermal withdrawal latency. Analyses of data were done by two-way ANOVA for repeated measures. Values indicate the mean ± standard error of mean (n = 6 animals/group). ∗p < 0.05 and ∗∗p < 0.01, for comparisons of the sham-operated group vs. the chronic constrictive injury (CCI) group or CCI-exercised group. #p < 0.05 and ##p < 0.01 for comparisons of the CCI-exercised group vs. the CCI group.
