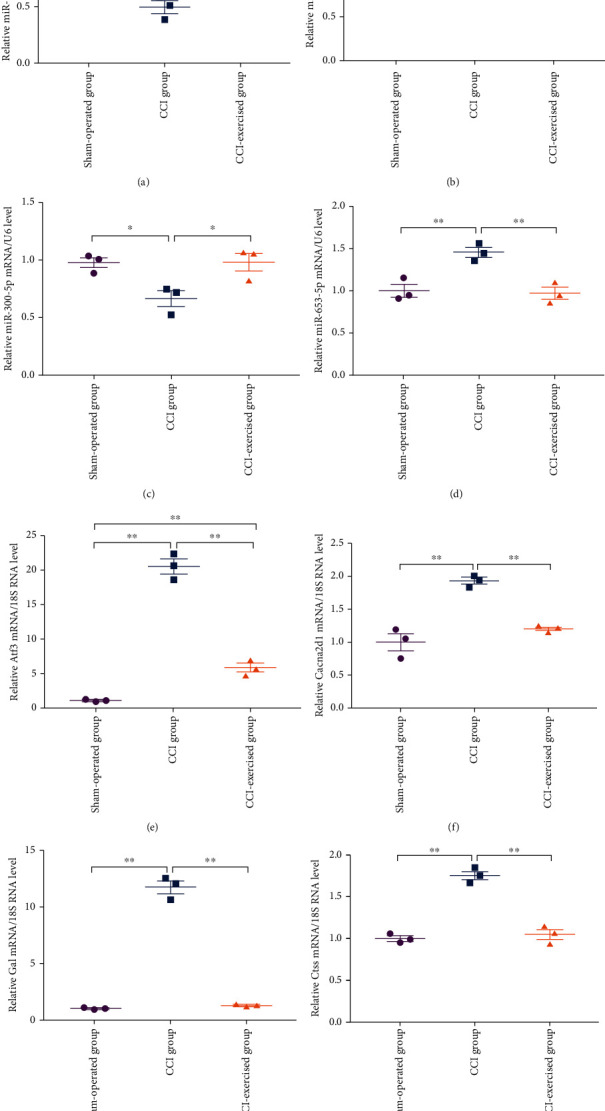
Figure 9.

Validation of DEGs by quantitative real-time PCR (qRT-PCR). mRNA expression levels of (a) mir-145-5p, (b) mir-341, (c) mir-300-5p, (d) mir-653-5p, (e) Atf3, (f) Cacna2d1, (g) Gal, and (h) Ctss in the L4–L6 DRG at 28 days after surgery. Analyses of data were done by one-way ANOVA, followed by Tukey's multiple comparison test. Values indicate the mean ± standard error of mean; n = 3 animals/group. ∗ denotes p < 0.05; ∗∗ denotes p < 0.01.
