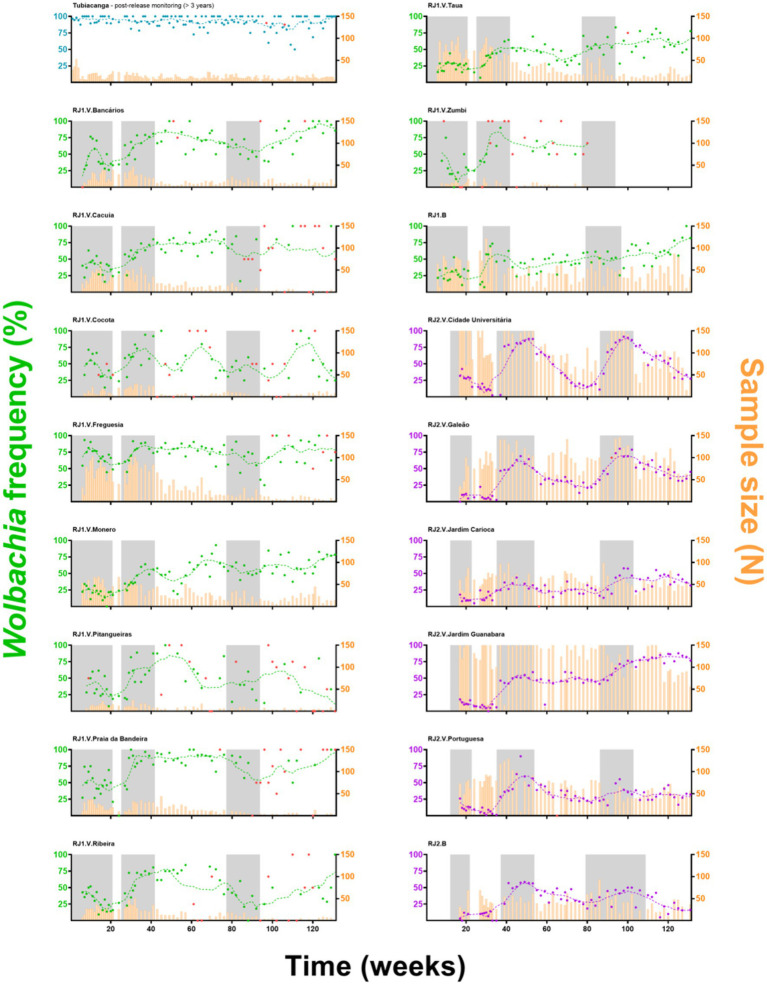
Figure 3.
Wolbachia’s invasion profiles in individual neighborhoods. Adult wMel-harboring Aedes aegypti were released (gray shading) across all neighborhoods of Ilha do Governador. Individual invasion profiles are depicted, with “RJ1” (green) or “RJ2” (purple) coding for the intervention area, and “V” or “B” for vehicle or backpack-assisted releases, respectively. Wolbachia prevalence indexes (%) are color coded and represented by dots plus second degree, seven-neighbors, moving averages (dashed lines), following the left Y-axis. Sample sizes are plotted as histograms (orange), following the right Y-axis. Prevalence indexes from small-sized samples (N < 5) are marked in red. The X-axis represents time (weeks), since the beginning of adult releases (Week1, August 2017) until recent days of field monitoring (Week 131, March 2020), with ticks scaled accordingly to represent 20-week bins. Post-release Wolbachia prevalence in Tubiacanga (blue), a previous intervention site, is shown as a standard for long-term field establishment.

