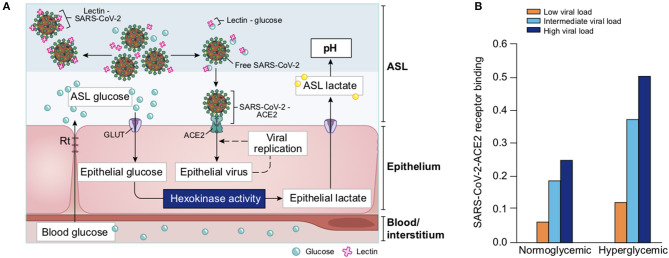
Figure 21.
Computational modeling of glucose-dependent SARS-CoV-2 infection. (A) Schematic representation of the parameters used in the different SARS-CoV-2 primary infection computational models. Blood glucose concentration and epithelial resistance (Rt) determine the glucose concentration in ASL. In the ASL, the number of virions, the concentrations of lectins and glucose determine the number of virions that reach and attach the receptor ACE2 for further endocytosis. Glucose in excess bind to lectin, leaving the virus free to reach the receptor. Epithelial glucose is depending on the ASL glucose concentration and the GLUT transporter number and activity. After endocytosis, the virus hijacks the metabolism of the cell and uses this epithelial glucose to replicate (epithelial virus number increases), leading to the production of lactate, which is released in the ASL, further lowering the pH of the ASL. GLUT, Glucose transporters (1, 2, 10); Rt, paracellular resistivity (1/Rt = paracellular conductivity in model) (see section Methods for details). (B) Simplified modeling of SARS-CoV-2—ACE2 binding, as a function of the viral load (represented by three different viral contents at the time of infection, see Definition of viral loads in methods) in a normoglycemic (0.4 mM ASL glucose) or hyperglycemic patient (1.2 mM ASL glucose).

