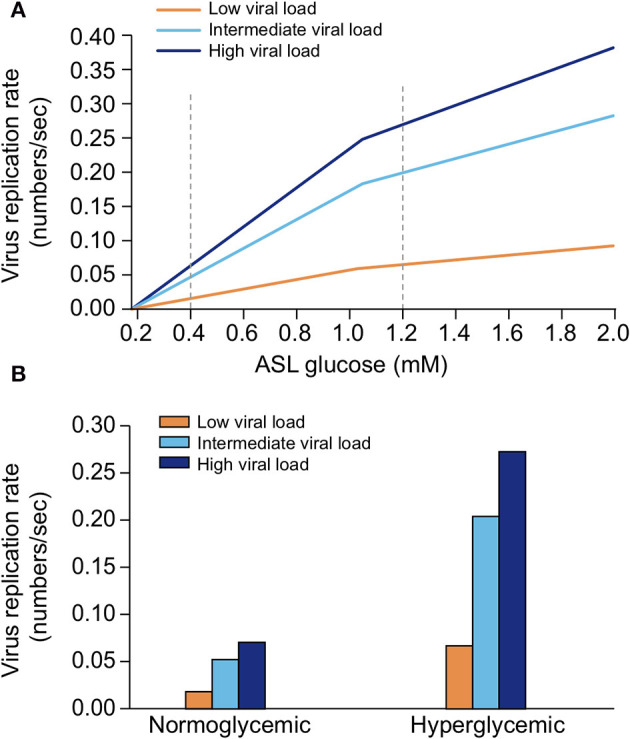
Figure 23.

Simplified computational model of SARS-CoV-2 replication rate as a function of glucose concentration in the ASL and viral load at time of a sneeze stimulus. (A) The dynamic of the viral replication, in case of three different viral load (low, intermediate, and high, see section Methods), as a function of a sweep over a range of glucose concentrations in ASL was computed and represented. (B) The values of viral replication rate in a normoglycemic (0.4 mM ASL glucose) or hyperglycemic case (1.2 mM ASL glucose) after a low, intermediate, or high viral load at time of infection are deduced from the model [see dashed line in (A)] and plotted.
