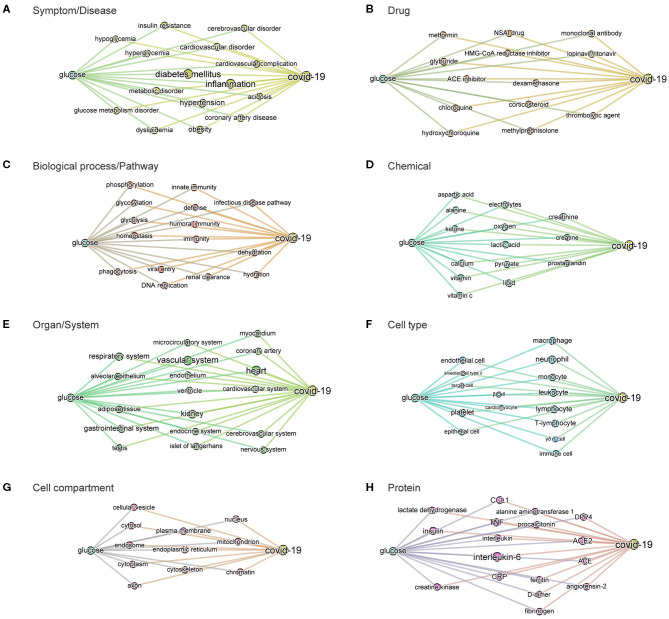
Figure 6.
BMIPs subgraphs from glucose to COVID-19 in each entity type. To obtain the subgraphs we, first, sliced the knowledge graph (built from the 3,000 most relevant articles related to the query “glucose as a risk factor for COVID-19”) according to different entity types (see Figure 2). As a result, we obtained a subgraph per entity type, containing only the entities of the given type. We then added the terms “glucose” and “COVID-19” to each of the subgraphs and then computed BMIPs from “glucose” to “COVID-19.” (A) Symptom/disease. (B) Drug. (C) Biological process/pathway. (D) Chemical. (E) Organ/system. (F) Cell type. (G) Cell compartment. (H) Protein.

