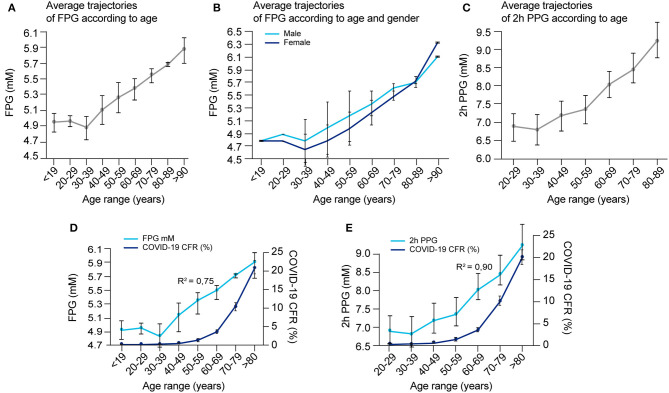
Figure 8.
Blood glucose concentrations according to age and gender and correlation with COVID-19 fatality. (A) Average FPG values per age range, (B) average FPG values per age range according to gender, and (C) average 2 h-PPG values after an OGTT test per age range were calculated according to raw data reported in several studies as detailed in Supplementary Table 5, and reported. (D) Overlay of COVID-19 CFR and FPG in function of age ranges [from data reported in (A) and Supplementary Figure 1B] and, (E) overlay of COVID-19 CFR and 2 h-PPG in function of age ranges [from data reported in (C) and Supplementary Figure 1B] are represented to detect possible correlation in between these age-related events. The correlation coefficient “R” that indicates how strong is the relationship between the two variables is calculated between the two respective series of values for the same age range, then R2, the coefficient of determination = R∧2.

