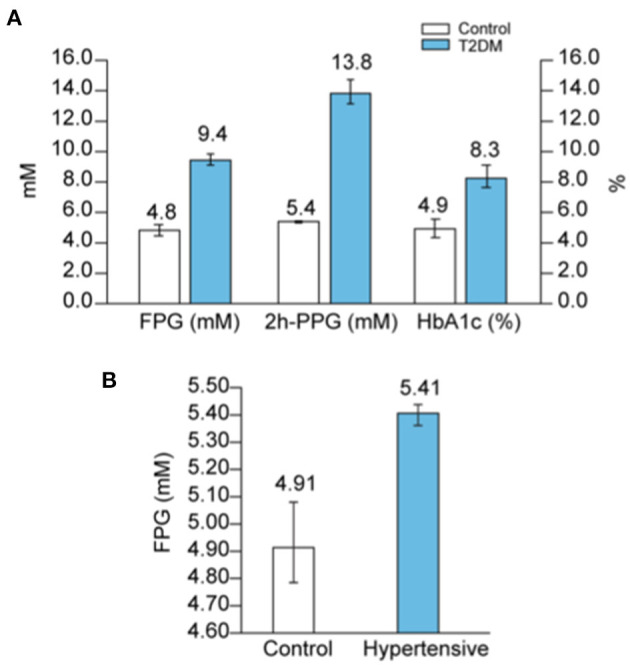
Figure 9.

Blood glucose in diabetes and hypertension. (A) Average values of FPG, 2h-PPG and HbA1c in diabetic people compared to controls were calculated according to raw data reported in several studies as detailed in Supplementary Table 4A, and reported. (B) Average values of FPG in hypertensive patients compared to controls were calculated according to raw data reported in several studies as detailed in Supplementary Table 4B, and reported.
