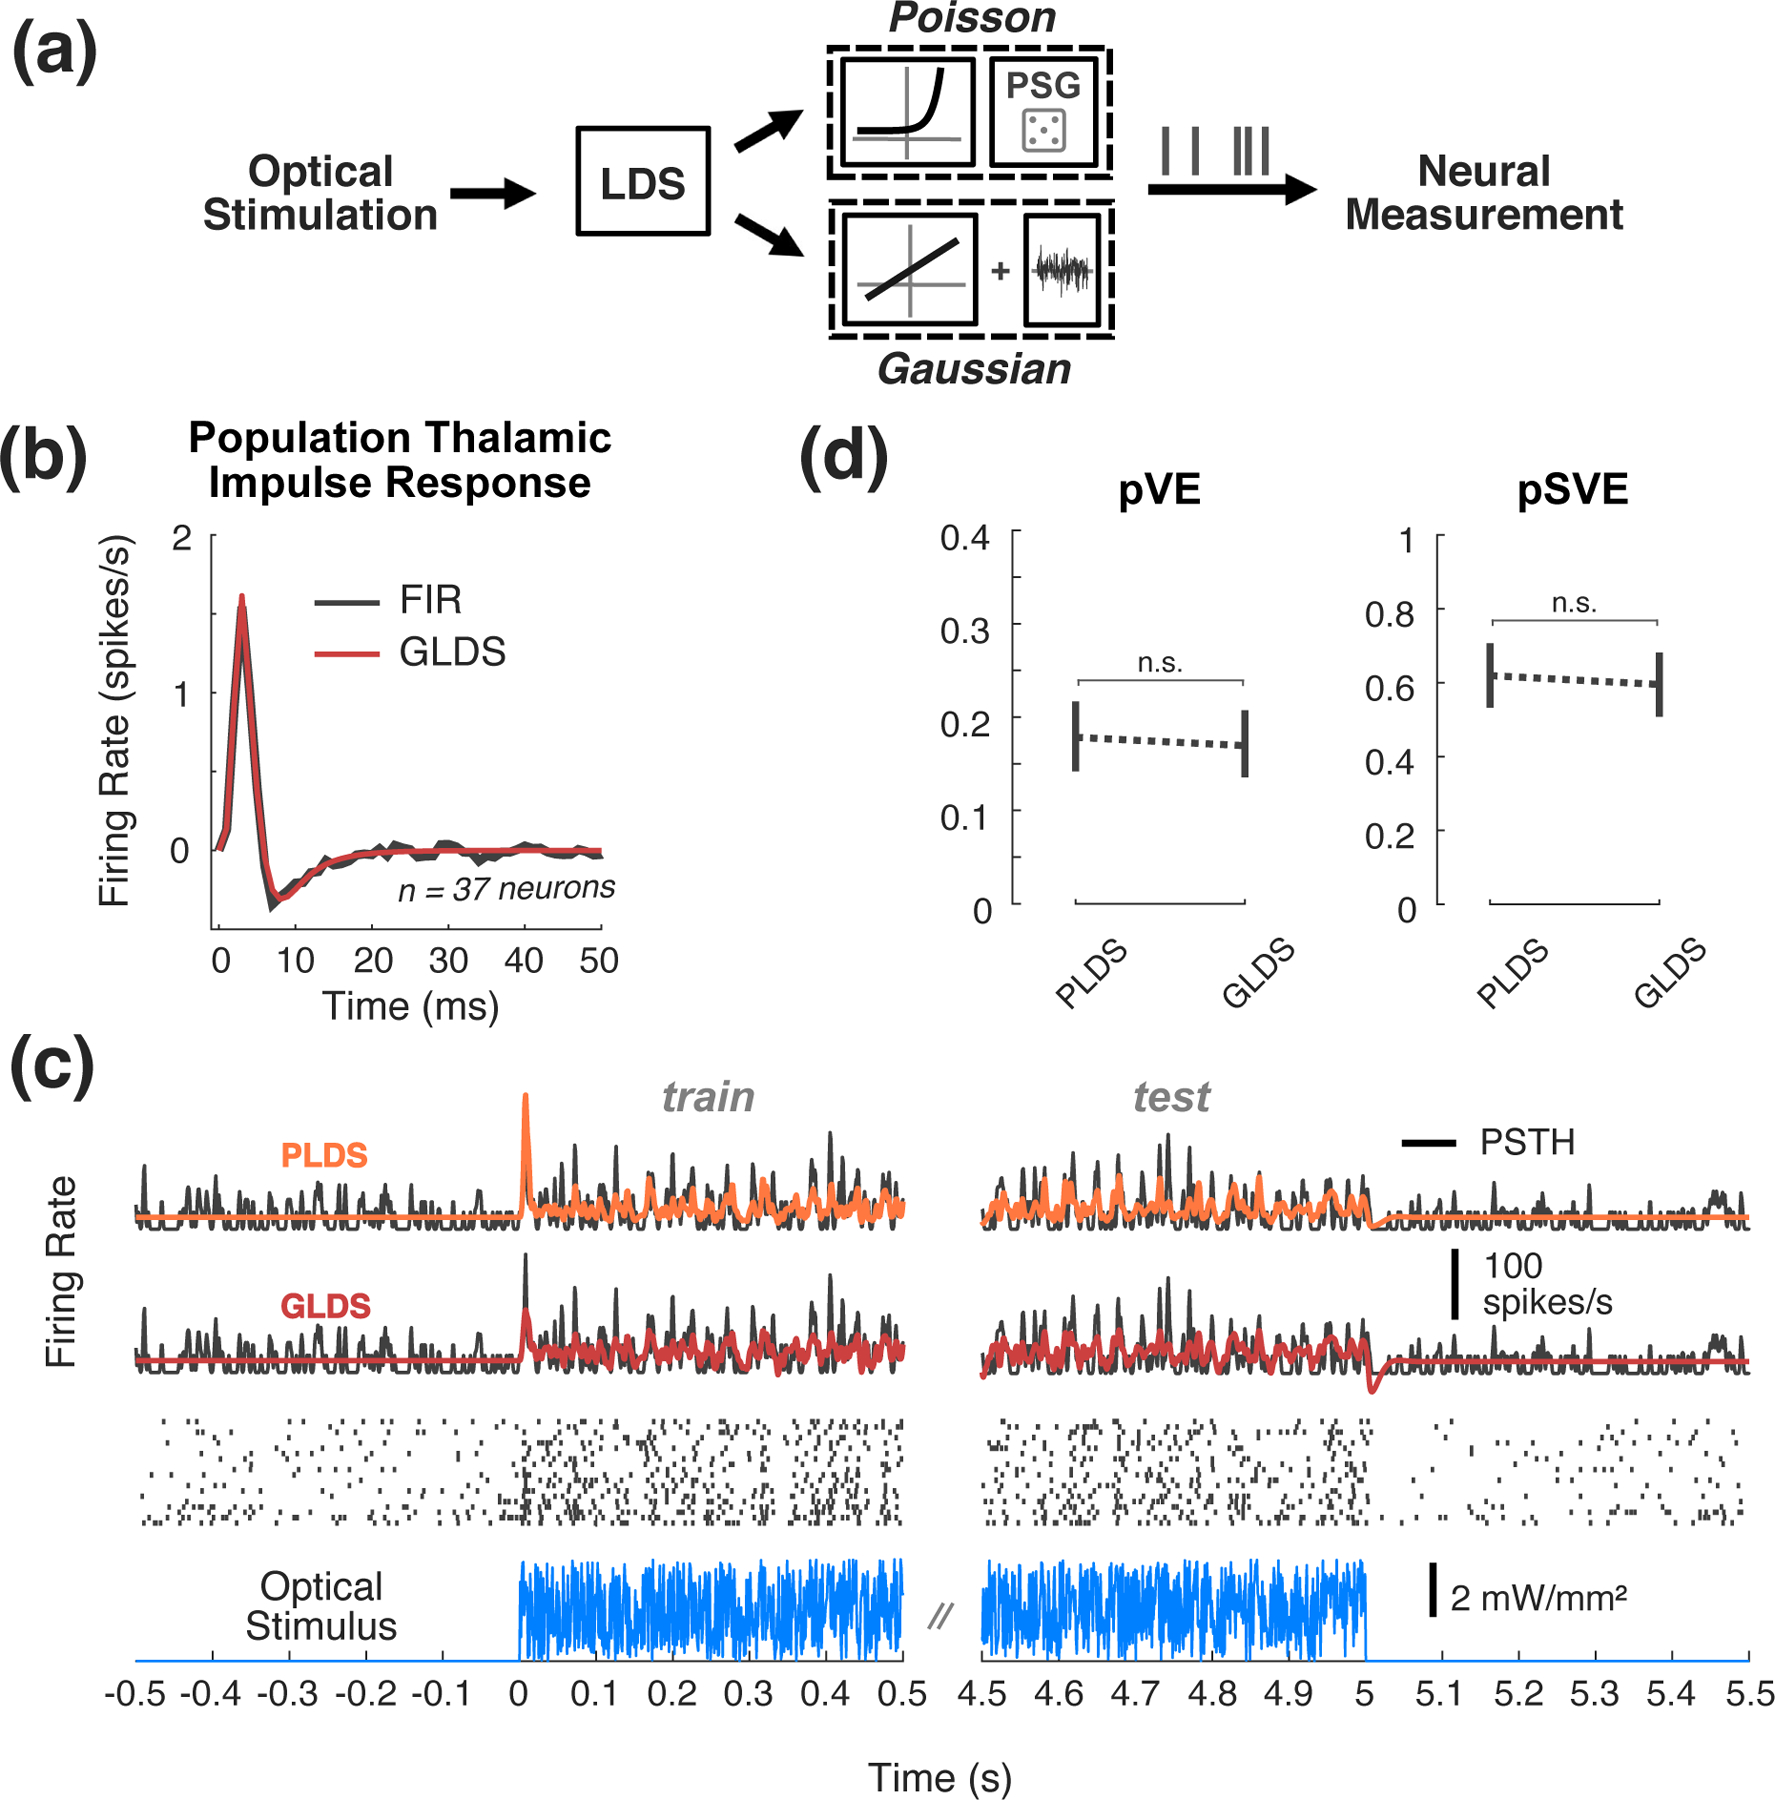
Figure 2: State-space models of SISO optogenetic responses.

(a) SISO LDS model structure: Poisson (top) or Gaussian (bottom) output functions being considered. (b) Population impulse response. This impulse response was fit using pooled data from 37 neurons that were excited by optical noise. An FIR model fit to population data (black) is plotted alongside the impulse response from the 5thorder GLDS model fit to the same data (red). (c) Example Data and Model Fits. Top, the PSTH (black) was smoothed with a 1 ms standard deviation Gaussian window for visualization. The fit types include 5th-order PLDS (orange), 5th-order GLDS (red). Middle, the corresponding trial-by-trial spike raster. Bottom, repeated instantiation of uniform optical noise. (d) Proportion variance in PSTH explained (pVE) and signal variance explained (pSVE) by model response to noise. All models were trained on data from first half of each trial, while model performance metrics (pVE, pSVE) were calculated from the second half of each trial. Error bars represent bootstrapped 95% confidence intervals about the population mean (n=48 neurons, 17 recordings, 9 animals).
