
Figure 4: Experimental SISO control and estimation.
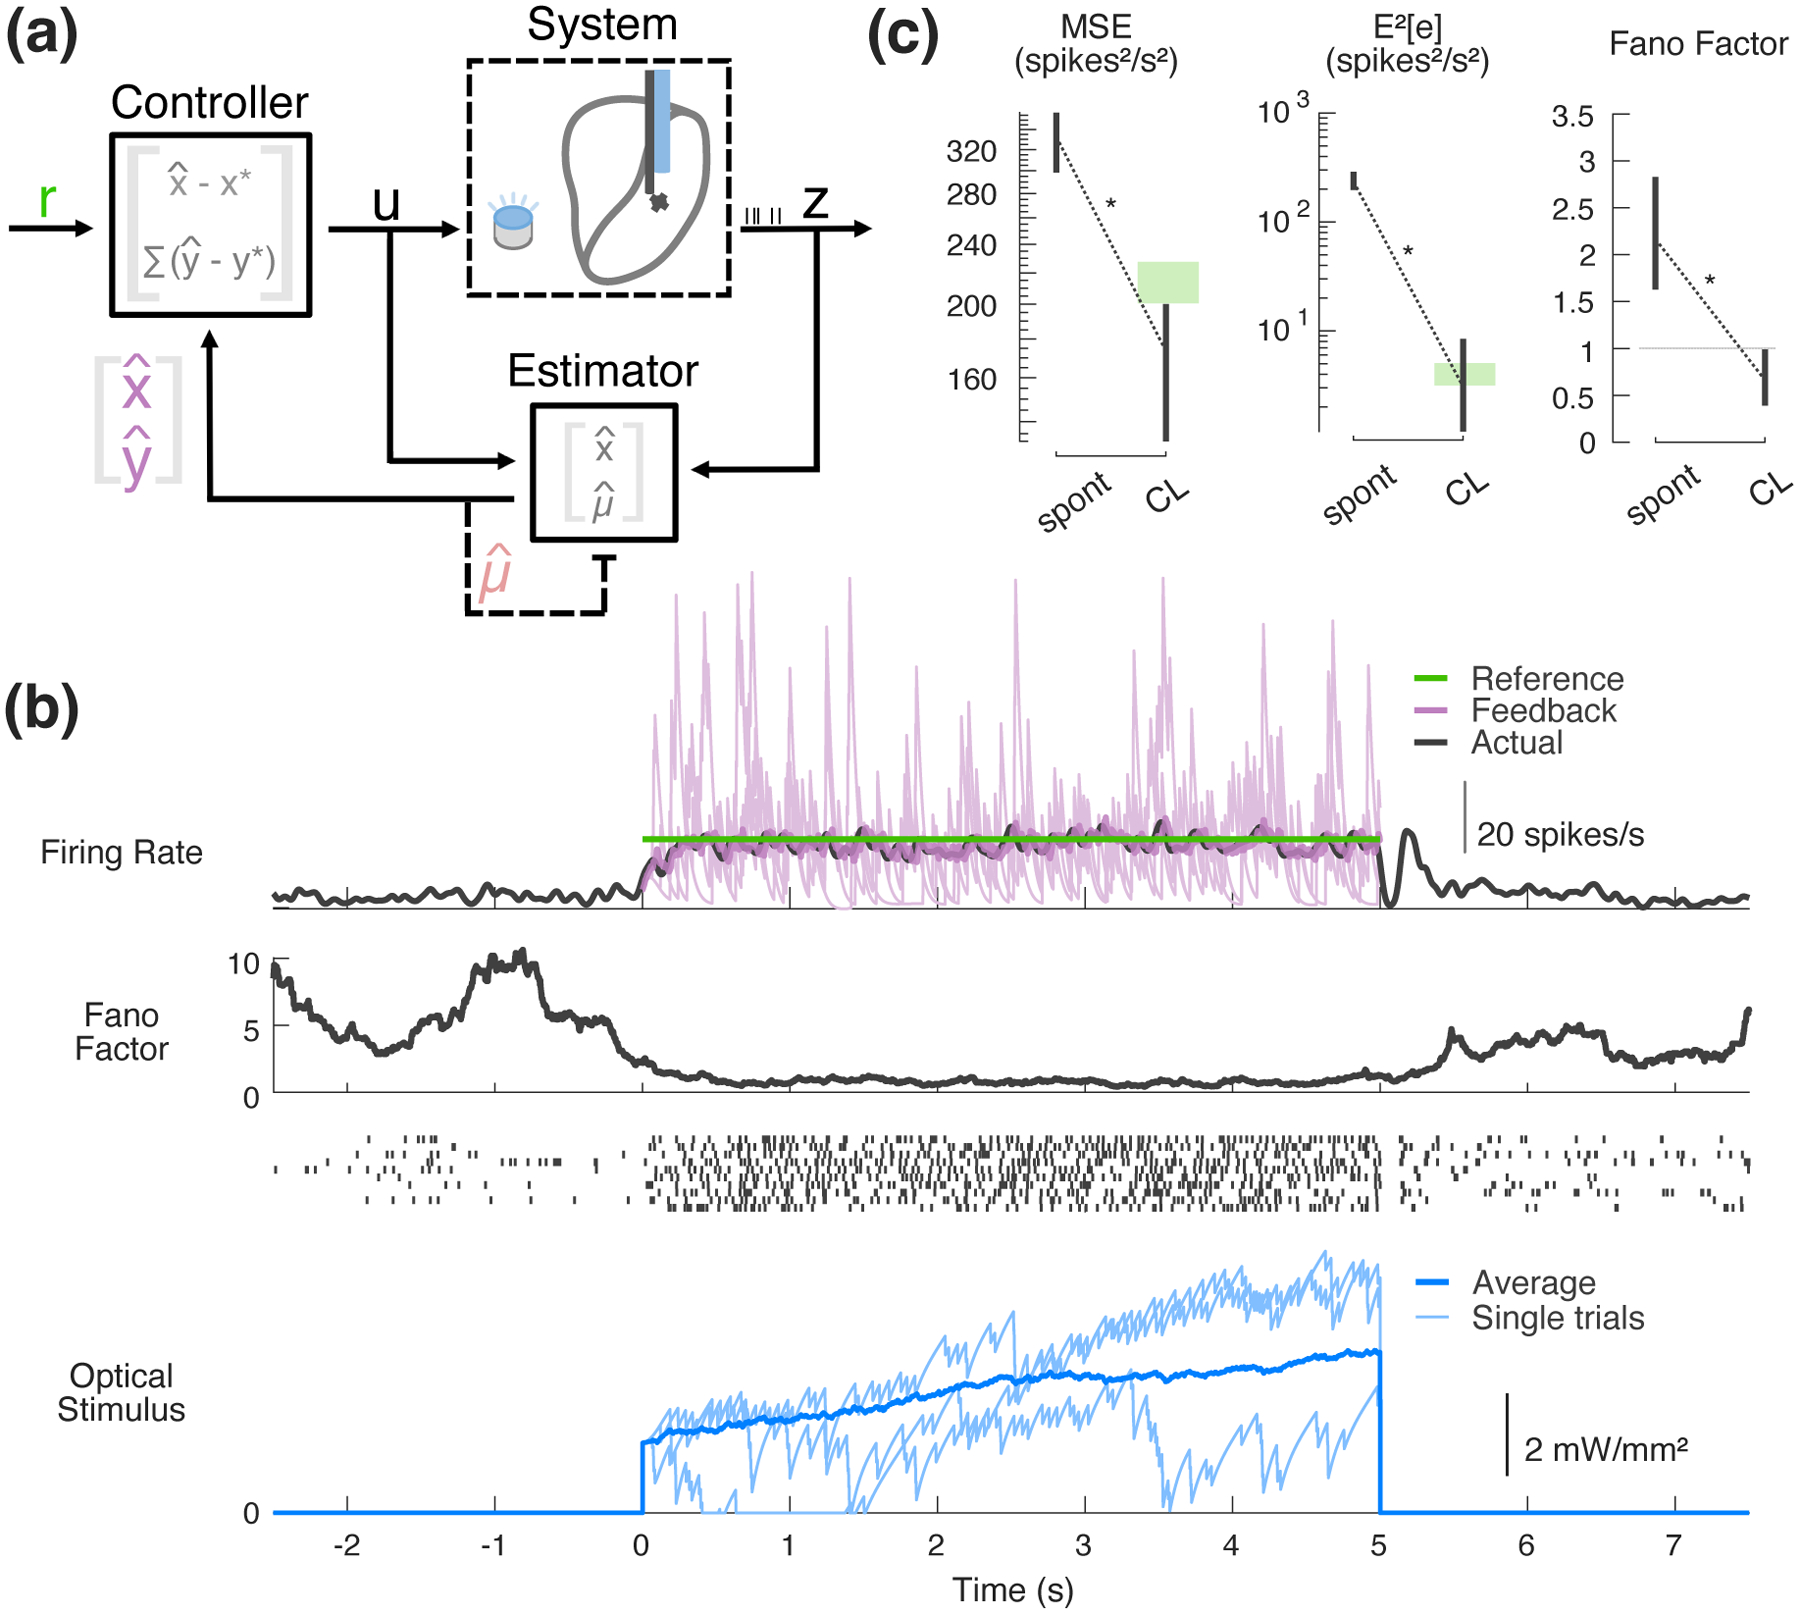
(a) SISO control block flow diagram. Shown inside the controller and estimator blocks are the notions of state being used in each operation. (b) Example experimental SISO control. (top) Fed-back online estimate in purple (single trial in light purple, trial-averaged in bold), along with the corresponding trial-average offline estimate (25 ms s.d. Gaussian-smoothed PSTH); (middle) across-trial spike count variability (Fano factor in 500 ms sliding window) and corresponding example spike rasters from 10 randomly selected trials; (bottom) controller input. (c) Population controller performance. In spontaneous vs. closed-loop (CL) control conditions, mean squared error (left) and squared bias (middle) were calculated between the reference (20 spikes/s) and single-trial feedback spiking data smoothed with a 25 ms s.d. Gaussian window; average Fano factor was also calculated (right). For each trial, four seconds of spontaneous data were compared to four seconds of CL control data. The first second was ignored in order to obtain a measure of steady-state performance. Error bars represent bootstrapped 95% confidence intervals about the mean. Green bands represent 95% confidence band for the metrics calculated from simulated Poisson firing at the target rate.