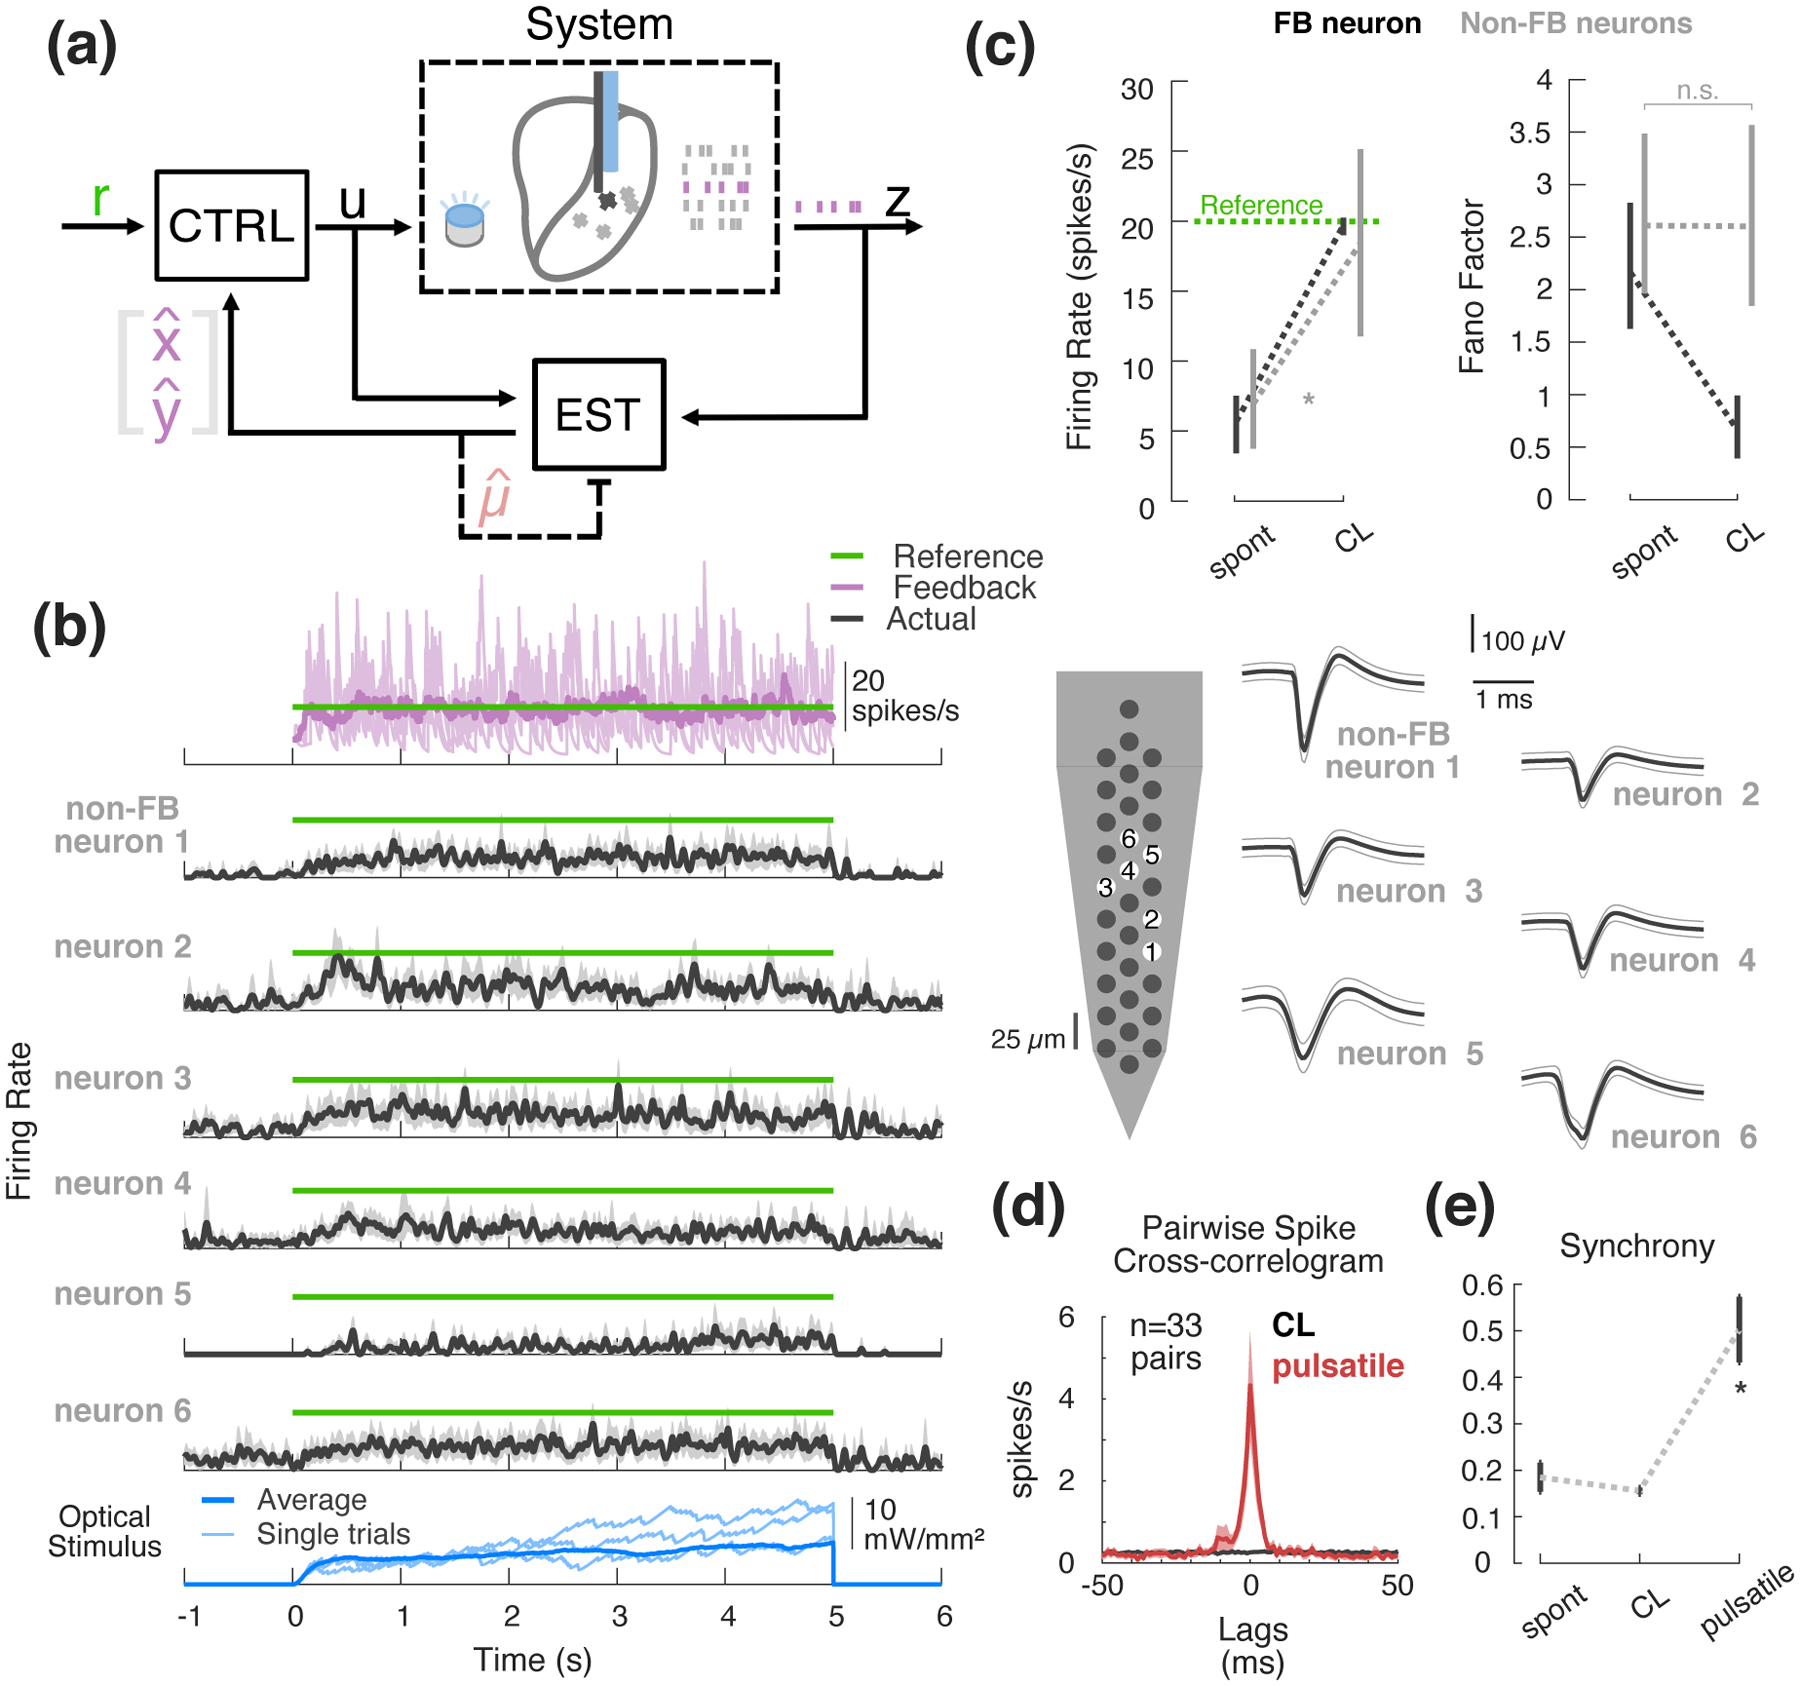
Figure 5: Effects of SISO control on local population.

(a) SISO control block flow diagram with multi-output recordings. (b) Example experimental SISO control with simultaneous multi-output recordings. (top) Fed-back online firing rate estimate in purple (single trial in light purple, trial-averaged in bold) relative to reference (green); (middle) trial-averaged firing rate estimates for simultaneously recorded non-FB neurons (25 ms s.d. Gaussian-smoothed PSTH); (bottom) controller input. To the right are the waveforms of each neuron in this example (average waveform in black, ±1 s.d. in grey). (c) Spontaneous vs. CL population average firing rate (left) and Fano factor (right) for the feedback neuron (black) as compared to the other non-feedback-neurons recorded simultaneously (grey). Error bars represent bootstrapped 95% confidence intervals about the mean. (d) Population spike cross-correlogram of simultaneously recorded pairs during optical stimulation. Bold black represents population mean in each 1 ms bin for CL, while fills represent 2 standard errors about the mean. For comparison, red represents population average spike cross-correlogram for response of the same cells to 5 ms square pulses of light presented in open-loop. (e) Population synchrony for spontaneous vs. closed-loop vs. pulsatile conditions. Synchrony was taken as the number of spikes occurring in the ±7.5 ms bins, relative to the total number of spikes in the ±50 ms window. Error bars represent 95% confidence intervals about the mean.
