
Figure 8: Simulated SIMO control and estimation.
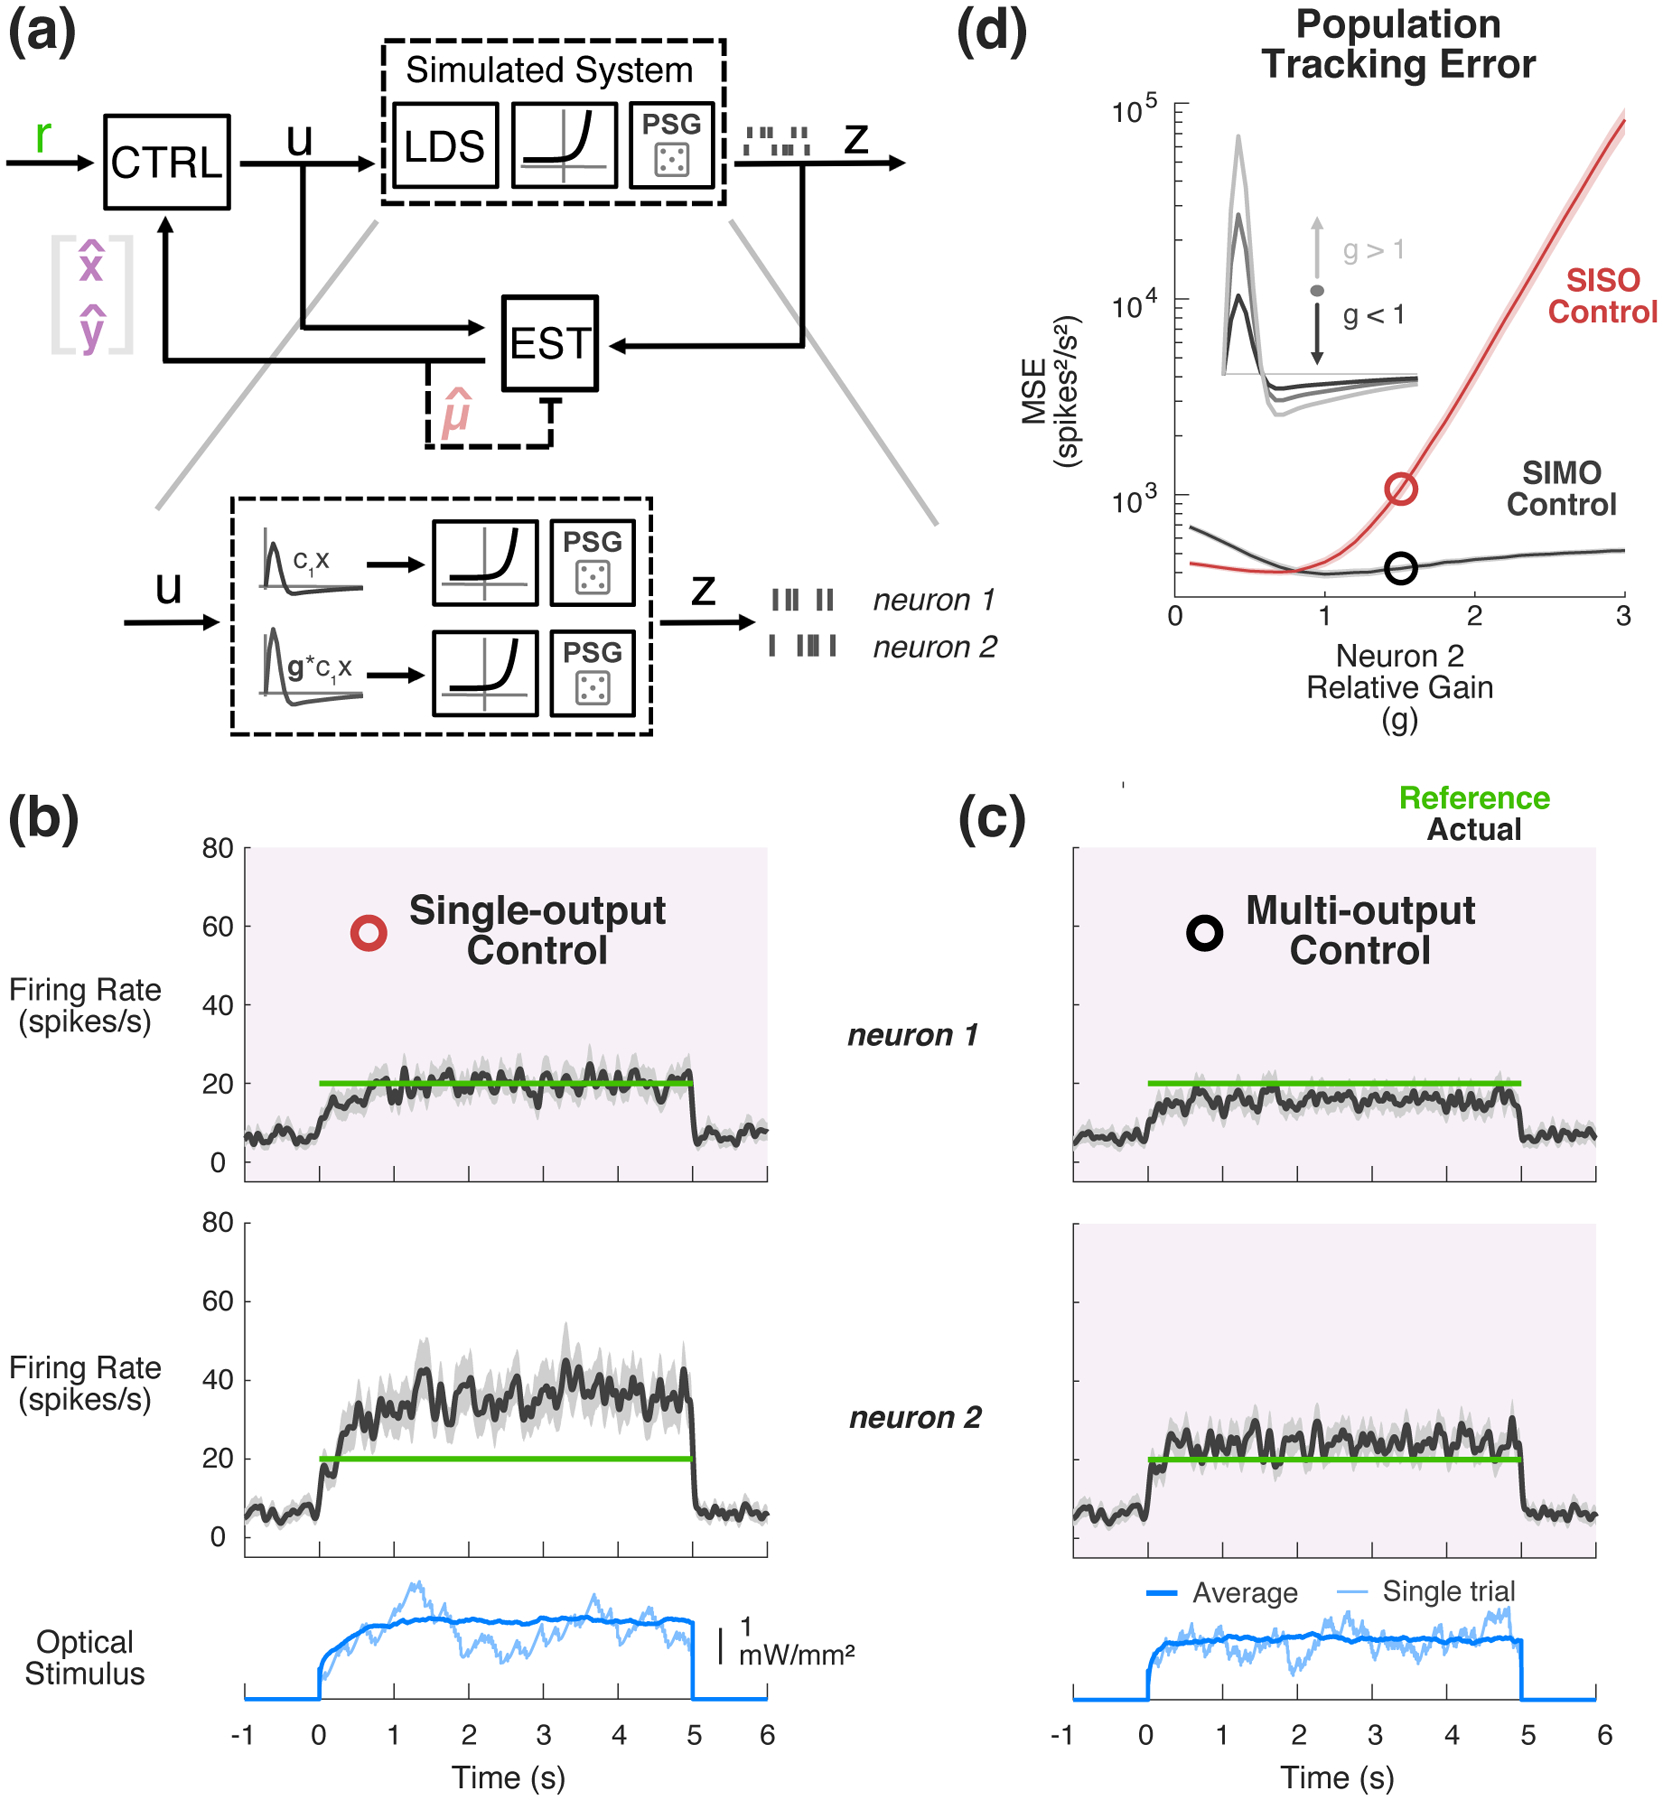
(a) Simulated control of a SIMO PLDS model system. A 2-output PLDS was simulated, whose second channel of output was a gain-modulated version of the first channel. (b) Example SISO Control. Only data from neuron 1 (top) was fed back during the simulated control. PLDS neuron 2 was 1.5 times more sensitive than neuron 1 before exponentiation in this example. Actual firing rate of each neuron (PSTH smoothed with 25 ms s.d. Gaussian) is shown in black as compared to reference (green). (c) Example of multi-output control. Both neurons’ data are fed back to controller for online estimation and control. Signals are the same as in (b). (d) Simulated mean-squared tracking error for SISO control of neuron 1 (red) vs. SIMO control (black) as a function of the relative log-linear gain of neuron 2. Circles denote mean-squared error for examples in (b), (c).